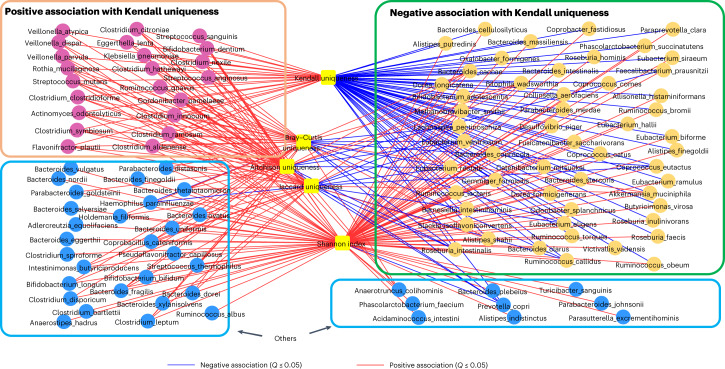
Fig. 2. Identification of species-level groups based on their pattern of association with different microbiome summary statistics.
Species fall into three groups based on their association pattern with Kendall uniqueness. Each edge indicates an association with Q ≤ 0.05, with colors blue and red indicating significant negative and positive associations, respectively. Based on their pattern of association, the microbiome taxa can be resolved into three partitions based on their association with Kendall uniqueness. A set of 54 species-level taxa containing many of the putatively beneficial symbionts show significantly negative association with Kendall uniqueness. A group of 22 species-level taxa containing many taxa previously shown to be associated positively with multiple diseases/unhealthy measures, like frailty1, associate positively with Kendall uniqueness. The disease/unhealthy aging links of the above two groups are further validated in Figs. 3 and 5. A third group of 36 taxa (highlighted as ’Others’) show no association with Kendall uniqueness.

