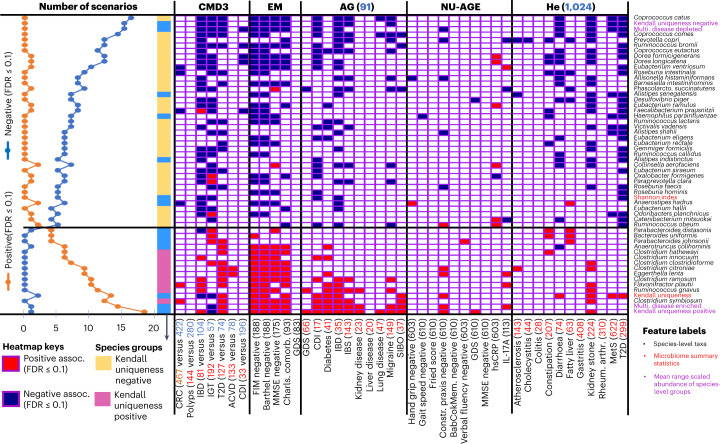
Fig. 4. Ranked order of microbiome features that show the most consistent associations with multiple measures of unhealthy aging.
The results are shown for 43 measures of unhealthy aging phenotype in five data repositories. Disease groups containing information from less than 20 gut microbiomes were not included in this analysis. Only those features that associate consistently with multiple measures of unhealthy phenotype individually in at least three of the five data repositories and at the maximum of only two association in the opposite direction are shown. The associations are shown for individual species, mean range-scaled abundances of the Kendall uniqueness-positive and negative groups (Fig. 2) and that of the multiple-disease-enriched and multiple-disease-depleted taxon groups identified in Ghosh et al. 1, along with multiple microbiome summary statistics used here (Methods). Q-values were obtained using Benjamini–Hochberg correction for each data repository-unhealthy measure combination. Features are arranged such that those showing the most negative associations with unhealthy older adult-specific scenario (at least with Q ≤ 0.1) are at the top, with a gradual shift to putatively detrimental features showing the most positive associations with negative health (at least with Q ≤ 0.1). The two groups differentially associating with unhealthy aging phenotypes are demarcated with horizontal lines. For each association, we have also indicated the number of gut microbiomes investigated. For CMD3 and ISC, containing samples from multiple studies, we used the matched patient-control studies pertaining to each disease (number of controls in blue font and patients in red font). For single AG and He cohorts, we compared taxon abundances in patients versus controls from the same data repository (size of each disease group indicated in red and the number of controls in blue besides the repository names). For EM and NU-AGE, all microbiomes were considered (number in parentheses), and associations were performed along a continuous gradient (Methods). Abbreviations: FIM, functional independence measure; Barthel, Barthel score; MMSE, Mini Mental State Examination; Charls. comorb., Charlson comorbidity; GDS, geriatric depression scale; hand grip, hand grip strength; Constr. praxis, sensitivity C-reactive protein; MetS, metabolic syndrome; Rheum. arthr., rheumatoid arthritis (Table 1 lists additional abbreviations).

