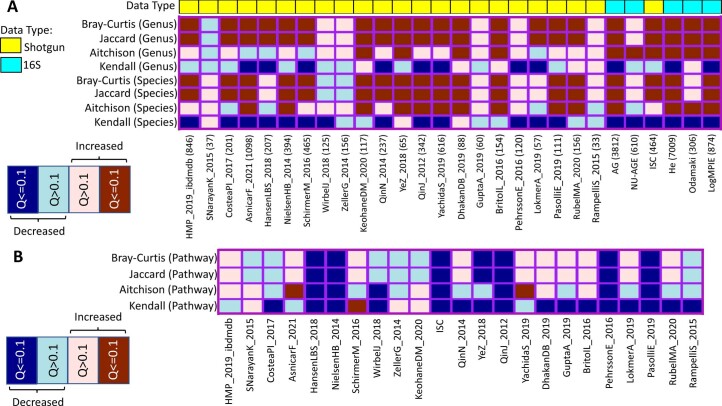
Extended Data Fig. 2. Links between diversity and uniqueness.
Heatmaps showing the association patterns between Shannon Diversity and the four measures of uniqueness at the level of: A. Species and Genus and B. Pathways. Each cell indicates the directionality and the strength between diversity and specific measure of uniqueness (given by the row) in a specific study (given by the column). The strengths are indicated in the legend key on the left. The number of gut microbiomes investigated in each study cohort is shown in parentheses for the corresponding studies for the top heatmap. The statistical significance of the associations were computed using two-sided robust F-tests. The p-values obtained for the association of the different microbiome summary indices were corrected on a per-study cohort basis using Benjamini–Hochberg correction to compute the Q-values.

