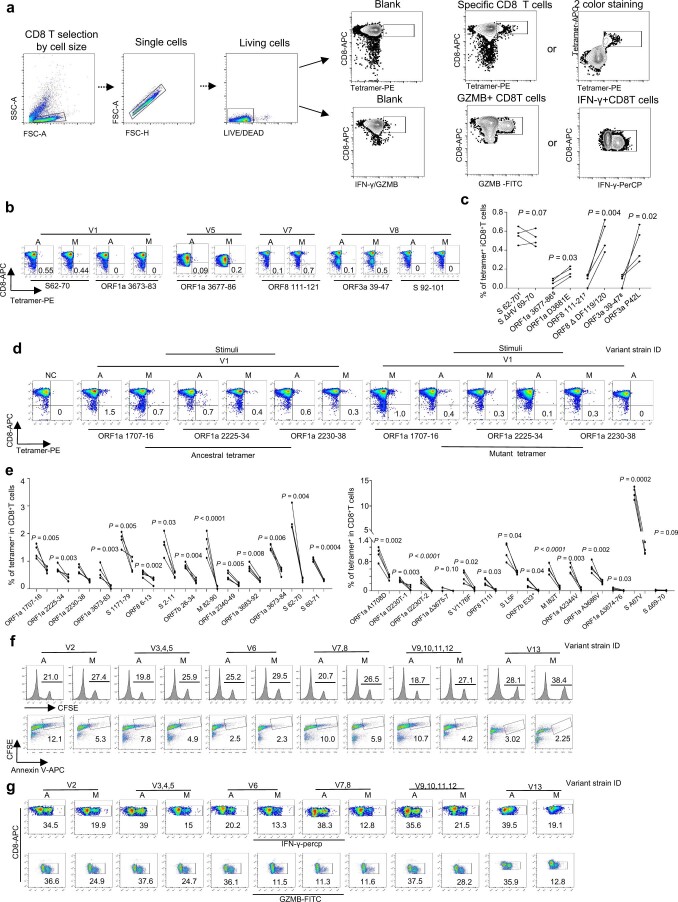
Extended Data Fig. 3. Immune response alteration by SARS-CoV-2 mutant epitopes.
(a) Flow cytometry gating strategy for SRAS-CoV-2 epitope specific CD8 T, GZMB+ CD8 T and IFNγ+ CD8 T cells, respectively. (b) Representative FACS results for CD8 T cell selection by tetramers containing SARS-CoV-2 epitope peptides. CD8 T cells from healthy donors were co-cultivated with T2 cells loaded with various peptides for specific CD8 T cell recognition. The cells were stained with corresponding tetramer containing ancestral or mutated epitope after 7 days. (c) Statistics of ancestral or mutant SARS-CoV-2 epitope specific CD8 T cells (n = 4). The pairs of ancestral and mutant epitopes shown here produced unchanged or increased CD8 T cell binding efficiency by mutated epitope comparing to ancestral. P-values are determined by two-sided T-test. (d) Cross-detection of epitope specific CD8 T cells with tetramers based on ancestral and corresponding mutant peptides. Left: ancestral or mutant epitopes stimulated CD8 T cells stained with ancestral peptide-based tetramer; Right: mutant or ancestral epitopes stimulated CD8 T cells stained with mutant peptide-based tetramer. (e) Statistics of cross-detection of epitope specific CD8 T cells (n = 4). Left: ancestral or mutant epitopes stimulated CD8 T cells stained with ancestral peptide-based tetramer; Right: mutant or ancestral epitopes stimulated CD8 T cells stained with mutant peptide-based tetramer. The P-values are calculated by paired t-test. NC: negative control, EBV virus peptide IVTDFSVIK. (f) Specific CD8 T cell mediated cytotoxicity evaluation after stimulation by ancestral and mutant epitopes from additional variant strains for 7 days. The remained CFSE labeled T2 cells were counted and presented as survived target cells (top row). The values in the flow cytometry chart indicate the percentage of surviving T2 cells. The proportion of CFSE+ Annexin V+ T2 cells presenting distinct SARS-CoV-2 antigens after 7 days culturing with CD8 T cells, as indicator for epitope stimulated T cell mediated T2 apoptosis (bottom row). (g) Detection of IFN-γ+ (top row) and Granzyme B+ (bottom row) CD8 T cells after stimulation by ancestral and mutant epitopes from additional variant strains for 7 days. Values in each panel indicate the percentage of IFN-γ+ CD8 + and Granzyme B+ CD8+ T cells, respectively. Variant strain ID numbers corresponds to SARS-CoV-2 variant strain IDs listed in Fig. 2a.

