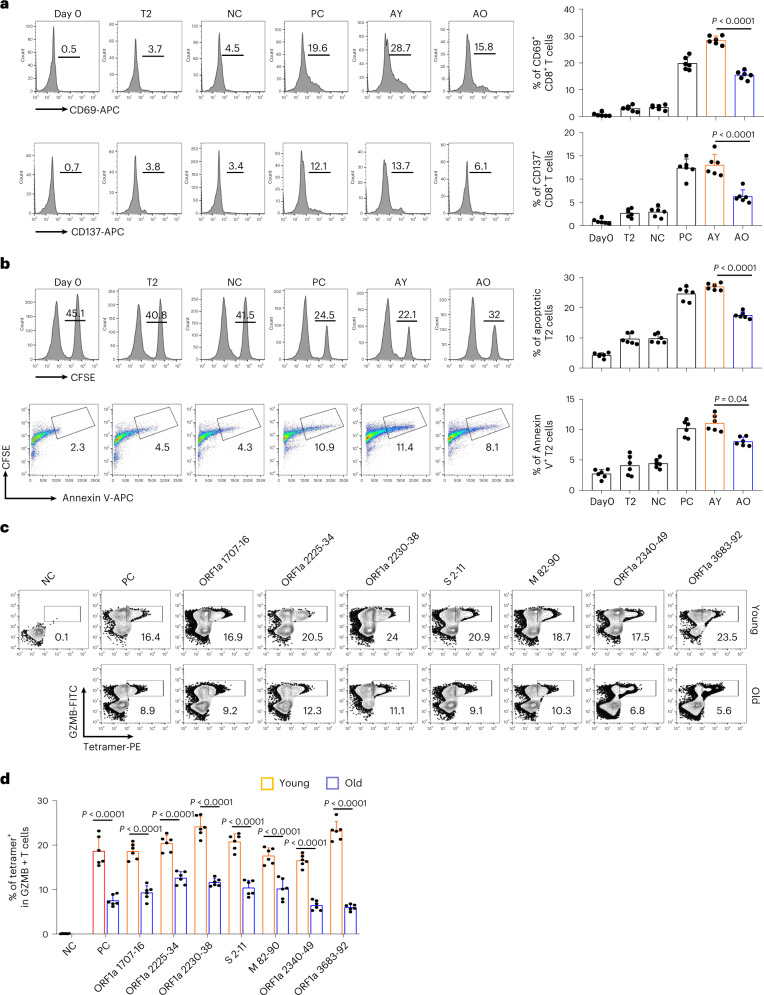
Fig. 5. Comparison and characterization of cytotoxic effects of SARS-CoV-2 epitope-specific CD8 T cells between young and old vaccine recipients.
a–d, Characterization of epitope-specific CD8 T cells after vaccination. CD8 T cells isolated from vaccinated donors after the second dose (day 50) were co-cultivated with T2 cells loaded with SARS-CoV-2 epitopes at a 1:1 ratio and analyzed for the expression of CD69 and CD137 after 16 hours (a), for target cell cytotoxicity (b) and for GZMB production after 7 days (c and d). For the cell cytotoxicity assay, T2 cells were labeled with CFSE and loaded with SARS-CoV-2 epitopes (ORF1a 1707–1716, ORF1a 2225–2234, ORF1a 2230–2238, S 2–11, M 82–90, ORF1a 2340–2349 and ORF1a 3683–3692) as target cells. Target cell cytotoxicity was assessed by the proportion of killed T2 cells and the apoptotic T2 cells. Day 0, control before stimulation; T2, T2 control cells without any peptide; NC, negative control, T2 cells loaded with EBV virus peptide IVTDFSVIK; PC, positive control, T2 cells loaded with influenza A M1 peptide GILGFVFTL; AY, co-cultivation with CD8 T cells from young donors; AO, co-cultivation with CD8 T cells from old donors. Data are summarized as mean ± s.d. n = 6 for each group. Statistical significance was determined by one-sided t-test or one-way ANOVA. The flow cytometry gating strategy is shown in Extended Data Fig. 4b.

