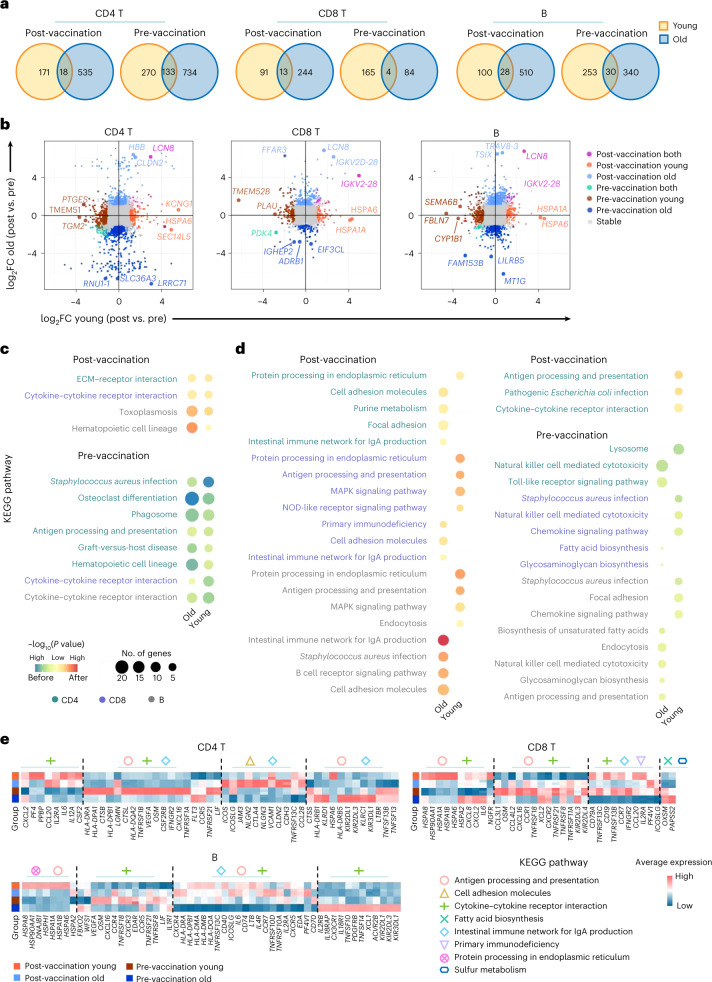
Fig. 6. Transcriptomic comparison of CD4 T, CD8 T and B cells between young and old donors before and after vaccination.
a, Venn diagrams of the significantly upregulated genes before and after vaccination in the young and old donors, from CD4 T, CD8 T and B cells, respectively. b, Scatter plot visualization of gene expression fold changes between pre-vaccination and post-vaccination in CD4 T, CD8 T and B cells from young and old donors. The top three DEGs between pre-/post-vaccination identified from young/old donors or both are labeled. See complete DEG list in Supplementary Table 3. c, KEGG pathway enrichment for vaccination-condition-specific genes identified from young and old donors. Yellow–blue color scale corresponds to the enrichment significance of the pre-vaccination upregulated genes; yellow–red color scale corresponds to the opposite. Dot size is proportional to the number of genes annotated to the corresponding pathway. P values are calculated by Fisherʼs exact test. d, KEGG pathway enrichment for vaccination-condition-specific genes identified from young or old donors. Color scale and dot size scale are the same as c. e, Heat map visualization of the expression levels of DEGs annotated to selected KEGG pathways. Heat map color reflects the average normalized expression levels across samples (n = 3) within each group. ECM, extracellular matrix; FC, fold change.

