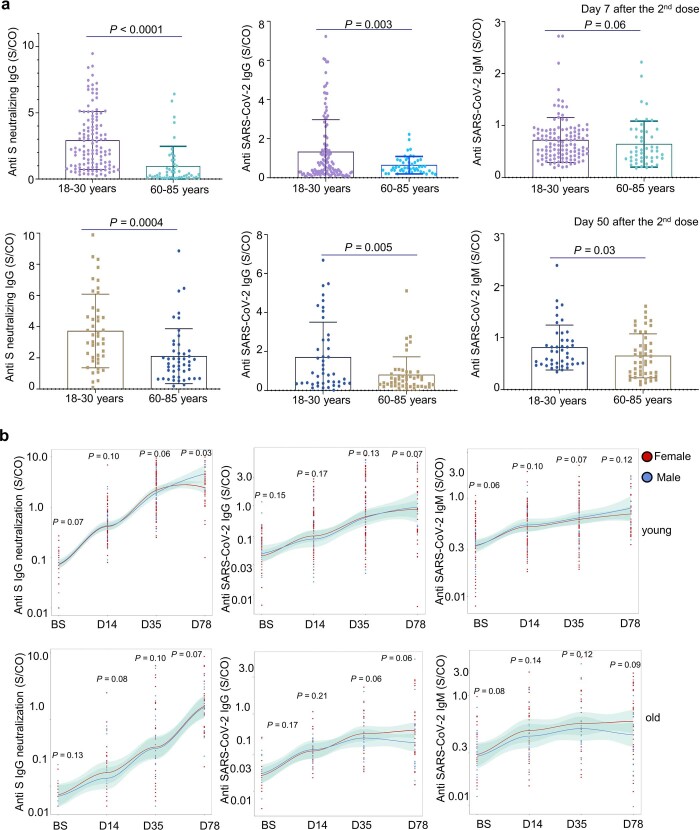
Extended Data Fig. 1. Statistics of anti-SARS-CoV-2 antibodies in inactivated SARS-CoV-2 vaccine recipients per age and gender group.
(a) Comparison of SARS-CoV-2 neutralizing antibody titer between young and old group on Day 7 (top row) and Day 50 (bottom row) after receiving the second dose of inactivated SARS-CoV-2 vaccine. Young: 18-30 years old, n = 121 for Day 7 after the second dose, n = 44 for Day 50 after the second dose; Old: 60-85 years old, n = 48 for both Day 7 and Day 50 after the second dose. Each dot represents a single individual. Data are summarized as mean ± SD. P-values are determined by two-sided T-test. (b) SARS-CoV-2 neutralizing IgG, total IgG and IgM quantification by ELISA. The data are presented for the young (top panel) and old (bottom panel) participants separated by gender. The regression line is shown in red for female and blue for male, with shading representing the 95% confidence interval. Young: 18-30 years old, 81 females and 40 males; Old: 60-85 years old, 27 females and 21 males. D14: 14 days after the 1st injection; D35: 35 days after the 1st injection, which was 7 days after the 2nd dose; D78: 78 days after the 1st injection, which was 50 days after the 2nd dose. Each dot represents a single individual. Two-sided T-test was used for assessing the significance of difference between two gender groups at each time point.

