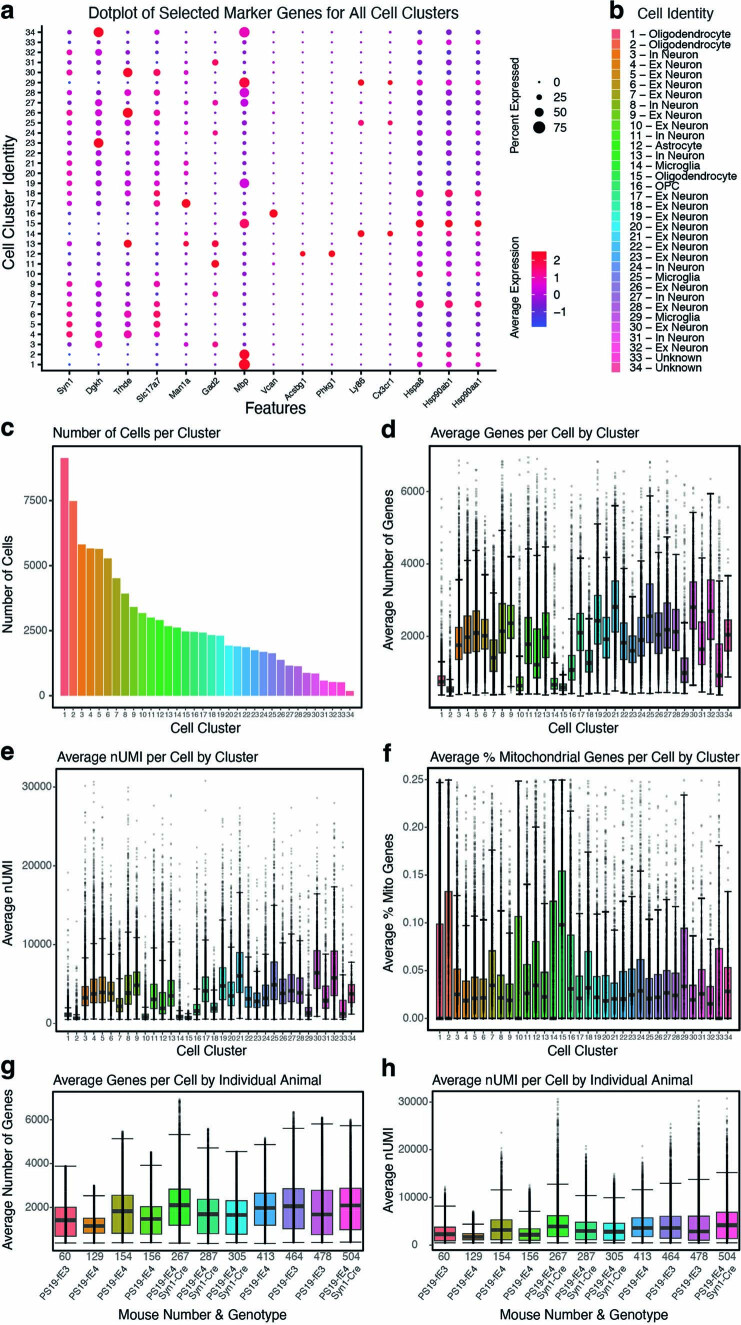
Extended Data Fig. 4. Quality control measures in snRNA-seq analysis of PS19-fE mice.
a, Dot-plot showing the normalized average expression of selected marker genes for all 34 distinct hippocampal cell clusters. b, Cluster identity of the 34 identified cell types. c, The number of cells per cluster. d, Boxplot of the number of genes per cell in each cluster. Each dot represents number of genes in a single cell in that cluster. e, Boxplot of nUMI per cell in each cluster. Each dot represents nUMI in a single cell in that cluster. f, Boxplot of the percentage of mitochondrial genes per cell in each cluster. Each dot represents the percentage of mitochondrial genes in a single cell in that cluster. g, Boxplot of the number of genes per cell in each individual animal. Each dot represents number of genes in a single cell from that animal. h, Boxplot of nUMI per cell in each individual animal. Each dot represents nUMI in a single cell from that animal. Number of cells (n) for each cell cluster can be found in c. For data in d-h, the lower, middle and upper hinges of the boxplots correspond to the 25th, 50th and 75th percentiles respectively. The upper whisker of the boxplot extends from the upper hinge to the largest value no further than 1.5 * IQR from the upper hinge (where IQR is the interquartile ranger, or distance between 25th and 75th percentiles). The lower whisker extends from the lower hinge to the smallest value at most 1.5 * IQR from the lower hinge. Data beyond the end of the whiskers are outlier points. For details of the analyses, see Methods.

