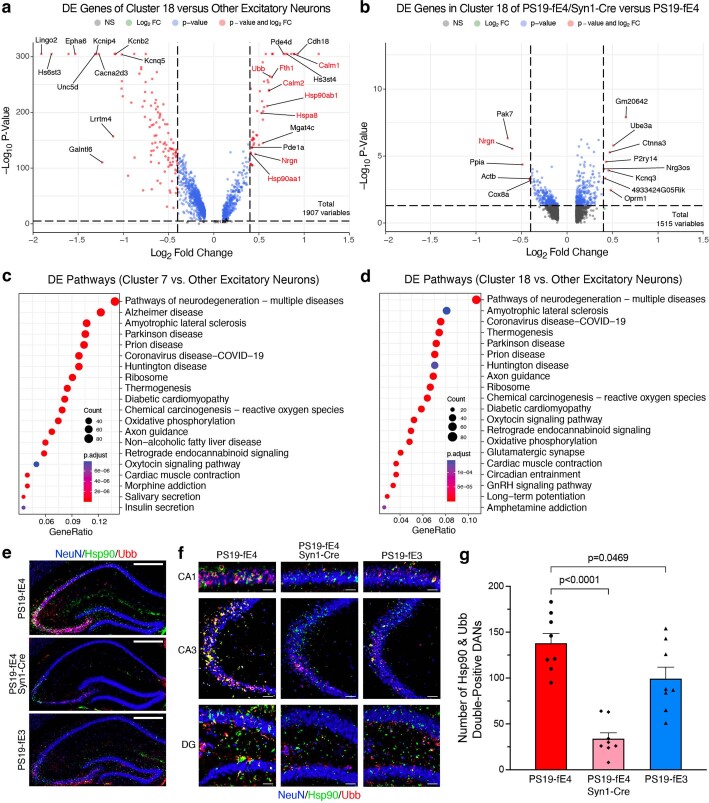
Extended Data Fig. 5. Neuronal APOE4 removal reduces disease-associated neurons (DANs).
a, Volcano plot of the differentially expressed (DE) genes between excitatory neuron cluster 18 and all other excitatory neuron clusters. The dashed lines represent log2 fold change threshold of 0.4 and p-value threshold of 0.00001. Gene names highlighted in red text indicate they are selected marker genes for DANs. b, Volcano plot of the DE genes in excitatory neuron cluster 18 in PS19-fE4/Syn1-Cre mice versus PS19-fE4 mice. The dashed lines represent log2 fold change threshold of 0.4 and p-value threshold of 0.05. In a,b, the unadjusted p-values and log2 fold change values used here were generated from the gene-set enrichment analysis (see Methods for details) using the two-sided Wilcoxon Rank-Sum test as implemented in the FindMarkers function of the Seurat package. c,d, Dot-plots of the top 20 KEGG pathways significantly enriched for the DE genes of excitatory neuron cluster 7 vs other excitatory neuron clusters (c), and excitatory neuron cluster 18 vs other excitatory neuron clusters (d) using over-representation or enrichment analysis. For c,d, p-values are based on a hypergeometric test and are adjusted for multiple testing using the Benjamini-Hochberg method. The size of the dots is proportional to the number of genes in the given gene set. Gene ratio represents the proportion of genes in the respective gene set that are deemed to be differentially expressed using the FindMarkers function in Seurat. e, Immunohistochemical staining for NeuN and two marker proteins (Hsp90 and Ubb) that are upregulated in the disease-associated neuron clusters 7 and 18 in the hippocampus of 10-month-old PS19-fE4, PS19-fE4/Syn1-Cre, and PS19-fE3 mice (scale bar, 500 µm). f, High magnification images of three hippocampal subregions for staining described in (e) (scale bars, CA1 50 µm, CA3 150 µm, DG 100 µm). g, Quantification of the number of NeuN+ neurons that are double-positive for Hsp90 and Ubb in the hippocampus of 10-month-old PS19-fE4, PS19-fE4/Syn1-Cre, and PS19-fE3 mice. Data in g are n = 8 mice per genotype and represented as mean ± SEM, one-way ANOVA with Tukey’s post hoc multiple comparisons test. DG, dentate gyrus.

