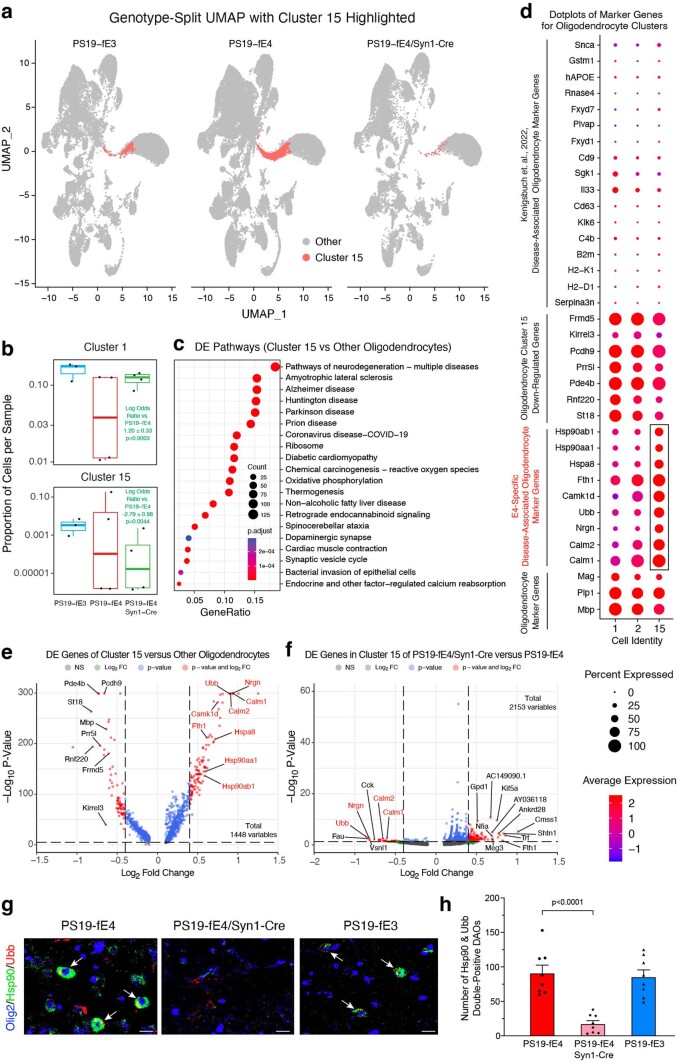
Extended Data Fig. 6. Neuronal APOE4 removal reduces disease-associated oligodendrocytes (DAOs).
a, UMAP plot highlighting cells in hippocampal cell cluster 15. b, Boxplot of the proportion of cells from each sample in clusters 1 and 15 of PS19-fE4 (n = 4), PS19-fE4/Syn1-Cre (n = 4), and PS19-fE3 mice (n = 3). The lower, middle, and upper hinges of the boxplots correspond to the 25th, 50th and 75th percentiles, respectively. The upper and lower whiskers extend to the largest and smallest value no further than 1.5 * IQR, respectively. The log odds ratios are the mean ± SEM estimates of log odds ratio for oligodendrocyte clusters 1 and 15, which represents the change in the log odds of cells per sample from PS19-fE3 or PS19-fE4/Syn1-Cre mice compared to the log odds of cells per sample from PS19-fE4 mice (Supplementary Table 1). P-values are unadjusted from fits to a GLMM_AM. c, Dot-plots of the top 20 KEGG pathways significantly enriched for the differentially expressed (DE) genes of oligodendrocyte cluster 15 versus all other oligodendrocyte clusters (over-representation or enrichment analysis). The p-values are based on a hypergeometric test and are adjusted for multiple testing using the Benjamini-Hochberg method. d, Dot-plot of normalized average expression of marker genes for oligodendrocyte clusters, highlighting marker genes (boxed) of DAO cluster 15. e, Volcano plot of the DE genes between oligodendrocyte cluster 15 and all other oligodendrocyte clusters. Dashed lines represent log2 fold change threshold of 0.4 and p-value threshold of 0.00001. Gene names in red are marker genes for DAOs. f, Volcano plot of the DE genes in oligodendrocyte cluster 15 in PS19-fE4/Syn1-Cre mice versus PS19-fE4 mice. Dashed lines represent log2 fold change threshold of 0.4 and p-value threshold of 0.05. g, Immunohistochemical staining for Olig2 and two markers (Hsp90 and Ubb) of the DAO cluster 15 (scale bar, 50 µm). h, Quantification of Olig2+ oligodendrocytes double-positive for Hsp90 and Ubb. In e,f, the unadjusted p-values and log2 fold change values were generated from the gene-set enrichment analysis using the two-sided Wilcoxon Rank-Sum test. Data in g,h are from 10-month-old mice (n = 8 mice/genotype) and represented as mean ± SEM, one-way ANOVA with Tukey’s post hoc multiple comparisons test.

