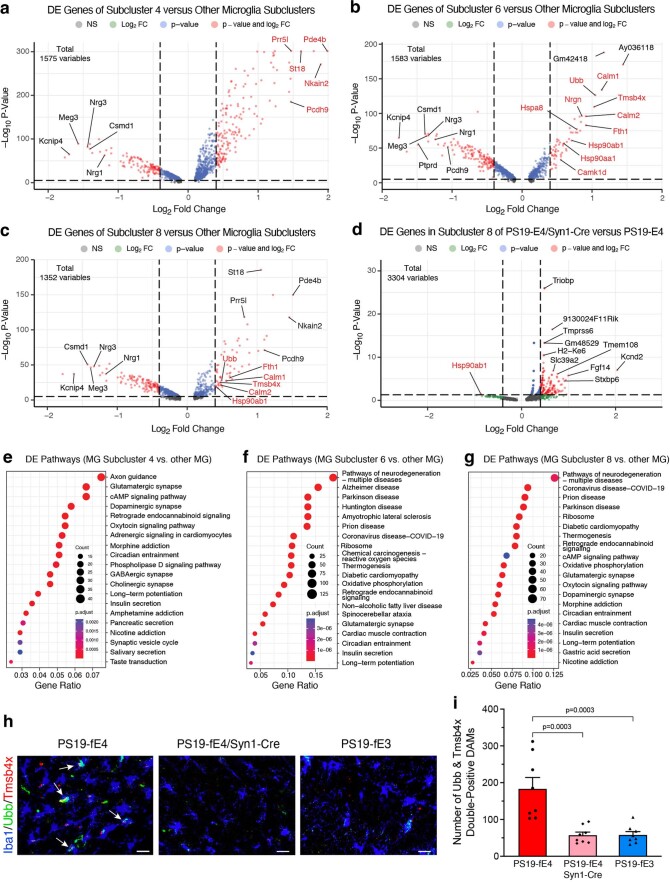
Extended Data Fig. 8. Neuronal APOE4 removal reduces disease-associated microglia (DAMs).
a, Volcano plot of the differentially expressed (DE) genes between microglia subcluster 4 and all other microglia subclusters. Gene names in red are marker genes for DAM. Dashed lines represent log2 fold change threshold of 0.4 and p-value threshold of 0.00001. b, Volcano plot of the DE genes between microglia subcluster 6 and all other microglia subclusters. Dashed lines represent log2 fold change threshold of 0.4 and p-value threshold of 0.00001. c, Volcano plot of the DE genes between microglia subcluster 8 and all other microglia subclusters. Dashed lines represent log2 fold change threshold of 0.4 and p-value threshold of 0.00001. d, Volcano plot of the DE genes in microglia subcluster 8 in PS19-fE4/Syn1-Cre mice versus PS19-fE4 mice. Dashed lines represent log2 fold change threshold of 0.4 and p-value threshold of 0.05. e, Dot-plot of the top 20 KEGG pathways significantly enriched for the DE genes of microglia subcluster 4 versus all other microglia subclusters (over-representation or enrichment analysis). f, Dot-plot of the top 20 KEGG pathways significantly enriched for the DE genes of microglia subcluster 6 versus all other microglia subclusters (over-representation or enrichment analysis). g, Dot-plot of the top 20 KEGG pathways significantly enriched for the DE genes of microglia subcluster 8 versus all other microglia subclusters (over-representation or enrichment analysis). h, Immunohistochemical staining for Iba1 and two markers (Tmsb4x and Ubb) of the disease-associated microglia subclusters 6 and 8 in the hippocampus (scale bar, 50 µm). i, Quantification of the number of Iba1+ microglia double-positive for Tmsb4x and Ubb in the hippocampus. Mice in h,i are 10-month-old. For data in a,b,c,d, the unadjusted p-values and log2 fold change values were generated from the gene-set enrichment analysis (see Methods for details) using the two-sided Wilcoxon Rank-Sum test. For data in e,f,g, the p-values are based on a hypergeometric test and are adjusted for multiple testing using the Benjamini-Hochberg method. The size of the dots is proportional to the number of genes in the given gene set. Data in i are n = 8 mice per genotype and represented as mean ± SEM, one-way ANOVA with Tukey’s post hoc multiple comparisons test.

