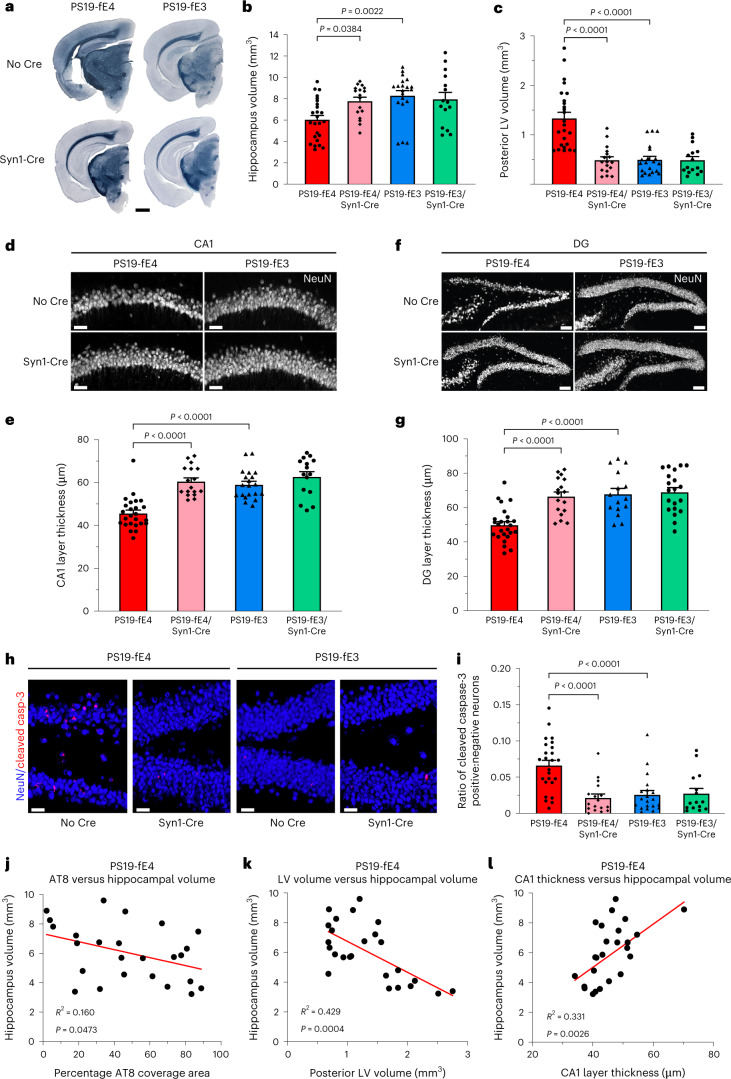
Fig. 2. Neurodegeneration is significantly reduced after neuronal APOE4 removal.
a, Representative images of the ventral hippocampus of 10-month-old PS19-fE4 and PS19-fE3 mice with and without Cre after staining with Sudan Black to enhance hippocampal visualization (scale bar, 1 mm). b,c, Quantification of hippocampal volume (b) and posterior lateral ventricle volume (c) in 10-month-old PS19-fE4 and PS19-fE3 mice with and without Cre. d, Representative images of the CA1 hippocampal subfield of 10-month-old PS19-fE4 and PS19-fE3 mice with and without Cre after immunostaining for neuronal marker NeuN (scale bar, 50 µm). e, Quantification of the thickness of the CA1 neuronal cell layer of 10-month-old PS19-fE4 and PS19-fE3 mice with and without Cre. f, Representative images of the hippocampal dentate gyrus of 10-month-old PS19-fE4 and PS19-fE3 mice with and without Cre after immunostaining for neuronal marker NeuN (scale bar, 100 µm). g, Quantification of the thickness of the dentate gyrus granule cell layer of 10-month-old PS19-fE4 and PS19-fE3 mice with and without Cre. h, Representative images of the hippocampal dentate gyrus of 10-month-old PS19-fE4 and PS19-fE3 mice with and without Cre after immunostaining for NeuN and cleaved caspase-3 (scale bar, 50 µm). i, Quantification of the ratio of neurons positive:negative for cleaved caspase-3 in the dentate gyrus of 10-month-old PS19-fE4 and PS19-fE3 mice with and without Cre. For all quantifications in b,c,e,g,i, PS19-fE4: No Cre, n = 25; Syn1-Cre, n = 17; and PS19-fE3: No Cre, n = 20; Syn1-Cre, n = 15 mice. All data are represented as mean ± s.e.m., one-way ANOVA with Tukey’s post hoc multiple comparisons test. j–l, Correlations between hippocampal volume (mm3) and AT8 coverage area (%) (j), posterior lateral ventricle volume (mm3) (k) and CA1 neuronal cell layer thickness (µm) (l) in PS19-fE4 mice (n = 25). Pearson’s correlation analysis (two-sided). LV, lateral ventricle; DG, dentate gyrus.Source data.

