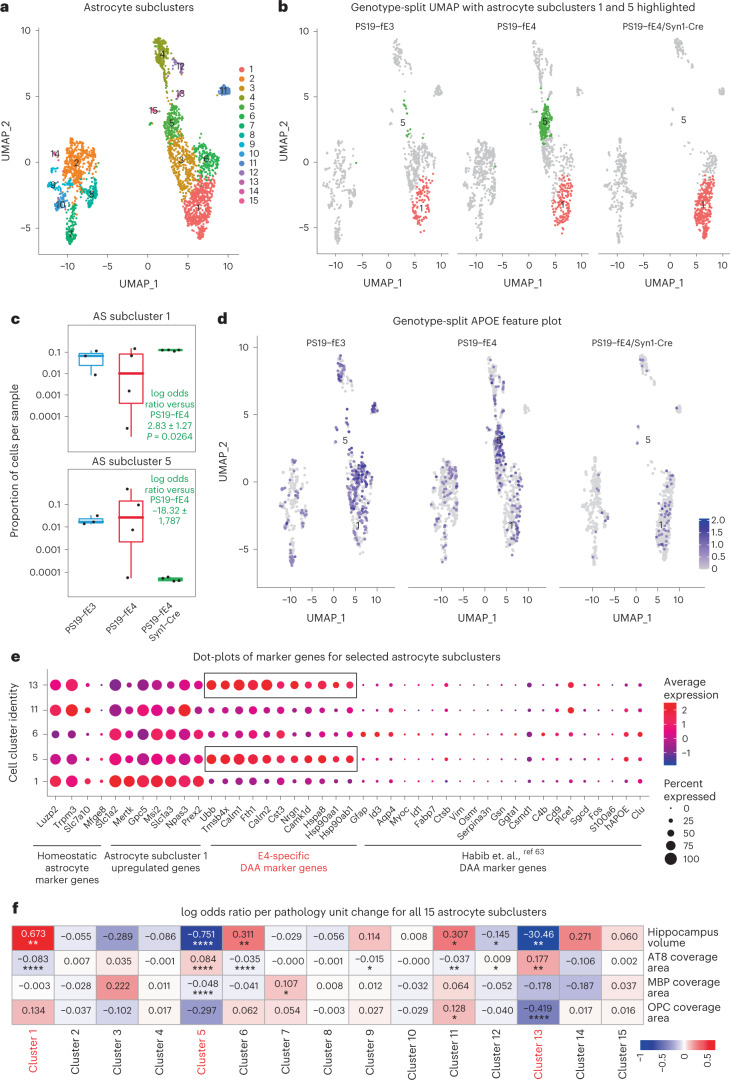
Fig. 7. Neuronal APOE4 removal increases disease-protective astrocytes and decreases disease-associated astrocytes.
a, UMAP plot of 15 astrocyte subclusters after subclustering hippocampal cell cluster 12. b, UMAP plot highlighting cells in astrocyte subclusters 1 and 5 in PS19-fE4 mice with no Cre (n = 4), or with Syn1-Cre (n = 4) and PS19-fE3 mice with no Cre (n = 3). c, Box plot of the proportion of cells from each sample in astrocyte subclusters 1 and 5. PS19-fE4 mice with no Cre (n = 4), or with Syn1-Cre (n = 4) and PS19-fE3 mice with no Cre (n = 3). The lower, middle and upper hinges of the box plots correspond to the 25th, 50th and 75th percentiles, respectively. The upper whisker of the boxplot extends from the upper hinge to the largest value no further than 1.5 × IQR from the upper hinge. The lower whisker extends from the lower hinge to the smallest value at most 1.5 × IQR from the lower hinge. Data beyond the end of the whiskers are outlier points. The log odds ratios are the mean ± s.e.m. estimates of log odds ratio for astrocyte subclusters 1 and 5, which represents the change in the log odds of cells per sample from PS19-fE4/Syn1-Cre mice belonging to the respective clusters compared to the log odds of cells per sample from PS19-fE4 mice. There are no cells from PS19-fE4/Syn1-Cre mice in astrocyte subcluster 5, so statistical significance for the log odds ratio is not reported (Supplementary Table 3). d, Feature plot illustrating the relative levels of normalized human APOE gene expression across all astrocyte subclusters for each mouse genotype group. e, Dot-plot of normalized average expression of marker genes for selected astrocyte subclusters, highlighting genes that are significantly upregulated and downregulated in astrocyte subclusters 5 and 13. f, Heat map plot of the log odds ratio per unit change in each pathological parameter for all astrocyte subclusters, with clusters that have significantly increased or decreased logs odds ratio after neuronal APOE4 removal highlighted in red (refer to c). Negative associations are shown in blue and positive associations are shown in red. Unadjusted P values in c are from fits to a GLMM_AM and unadjusted P values in f are from fits to a GLMM_histopathology (Supplementary Table 4 and Methods provide further details); the associated tests implemented in these model fits are two-sided. All error bars represent the s.e.m. AS, astrocytes.

