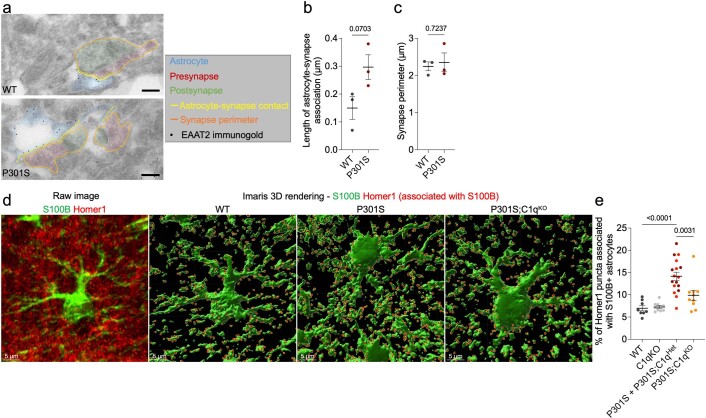
Extended Data Fig. 6. IEM and IHC analysis of astrocyte–synapse interaction.
(a) Representative immunoEM images of EAAT2 in hippocampal CA1 region. Presynapses are pseudo-colored in red, postsynapses in green. EAAT2+ astrocyte processes are shown in blue. The synapse perimeter is outlined in orange and the astrocytic plasma membrane that is in contact with the synapse in yellow. Scale bar = 200 nm. (b) Length of the astrocytic plasma membrane associated with the synapse in CA1 region from WT and P301S mice. (c) Quantification of synapse perimeter in CA1 region from WT and P301S mice. (d) Representative confocal image and Imaris 3D reconstructions of immunostained S100B (green) and Homer1 (red). In the 3D reconstructions only S100B-associated Homer1 puncta are shown. Scale bar = 5µm. (e) Percentage of Homer1 puncta that associated with S100B+ astrocytes. B, c Unpaired two-tailed t-test; e One-way ANOVA with Dunnett multi comparison test. Each dot shows average data from one mouse, in b,c) n = 3 mice/genotype, in e) n = 8–10 mice/genotype. All data are presented as mean ± SEM.

