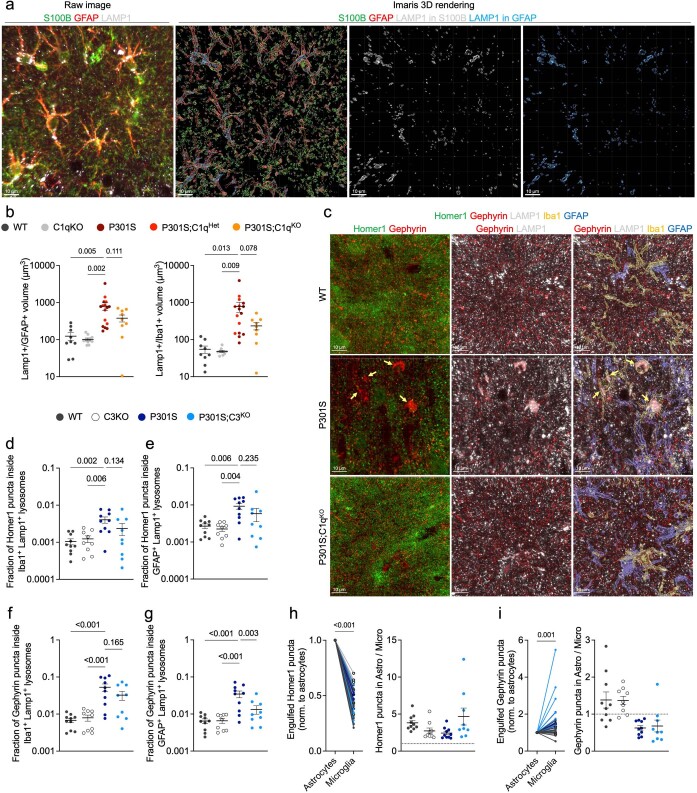
Extended Data Fig. 8. Complement-dependent engulfment of excitatory and inhibitory synapses by astrocytes and microglia in P301S mice.
(a) Representative image and Imaris 3D rendering of immunostained S100B (green), GFAP (red) and Lamp1 (white). 3D reconstructions show lysosomes (Lamp1 structures) within S100B+ astrocytes (white) or GFAP+ astrocytes (blue). Note that lysosome structures segmented within S100B+ and GFAP+ astrocytes are almost identical. Scale bar = 10µm. (b) Volume of LAMP1+ lysosomes inside astrocytes and microglia, respectively, in hippocampi from WT, C1qKO, P301S and P301S;C1qKO. (c) Representative images of WT, P301S and P301S;C1qKO brains immunostained for Homer1 (green), Gephyrin (red), LAMP1 (white), Iba1 (yellow) and GFAP (blue). Images on the right show 3D reconstructed GFAP+ astrocytes and Iba1+ microglia together with the raw immunofluorescence from Homer1, Gephyrin and LAMP1. Arrows highlight Gephyrin immunoreactivity accumulated in microglial lysosomes. Note that the neighboring astrocytic lysosomes do contain accumulated Gephyrin. (d,e) Fraction of Homer1 and Gephyrin puncta inside astrocytic or microglial lysosomes across genotypes. (f,g) Fraction of Gephyrin puncta inside astrocytic or microglial lysosomes across genotypes. (h) Normalized number of Homer1 puncta inside astrocytes or microglia, respectively (left graph) and ratio of Homer1 puncta within astrocytic/microglial lysosomes. (i) as in H) but showing engulfment data for Gephyrin. Dotted line at a ratio of 1 indicates that astrocytic and microglial lysosomes contained the same number of synaptic puncta, ratio of >1 means that more synaptic puncta were localized within astrocytic lysosomes and <1 indicates that microglial lysosomes contained more synaptic puncta. One-way ANOVA with Dunnett’s post hoc test (B, D-G) or paired two-tailed t-test (H, I). Each dot shows average data from one mouse. In b) 7–10 mice/genotype and in d-i) 9–10 mice/genotype were used. All data are presented as mean ± SEM.

