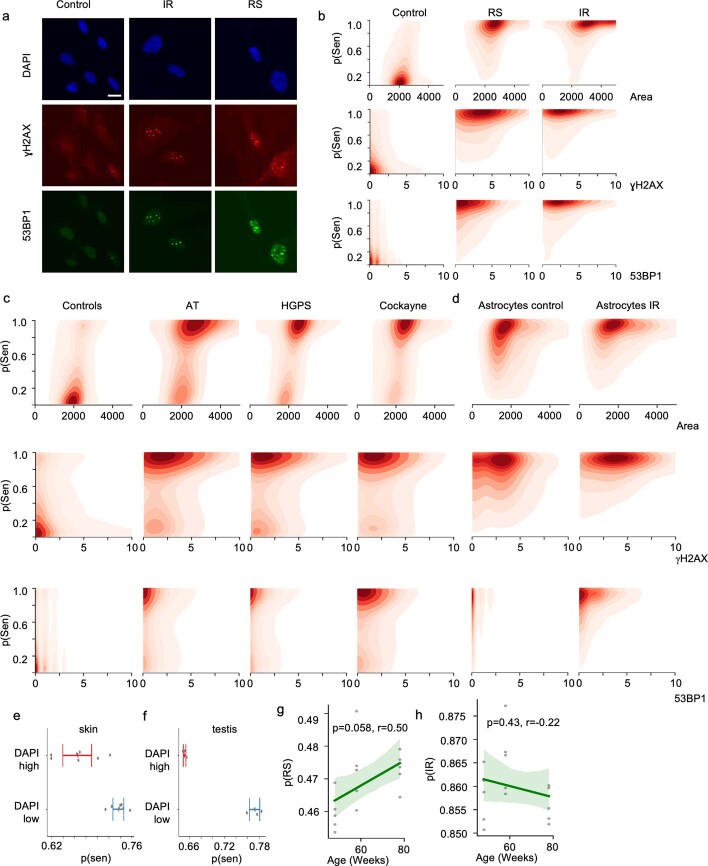
Extended Data Fig. 5. DNA Damage Foci and Other Senescence Indicators.
a Representative immunohistochemistry micrographs of nuclei with DNA damage foci staining of gH2AX and 53BP1; scale bars, 10 μm. b 2D histogram (density heatmap) of predicted senescence and foci count per senescence type. c 2D histogram (density heatmap) of predicted senescence and foci count for premature aging diseases. d 2D histogram (density heatmap) of predicted senescence and foci count for murine astrocytes. e Predicted senescence of skin nuclei for high and low DAPI (DAPI low n = 7, DAPI high n = 7; mean ± 95% CI, two-sided Student’s t-test). f Predicted senescence of testis nuclei for high and low DAPI (DAPI low n = 4, DAPI high n = 4; mean ± 95% CI, two-sided Student’s t-test). g Predicted probability for RS senescence (n = 5, mean ± 95% CI, Wald Test with t-distribution). h Predicted probability for IR senescence (same as g).

