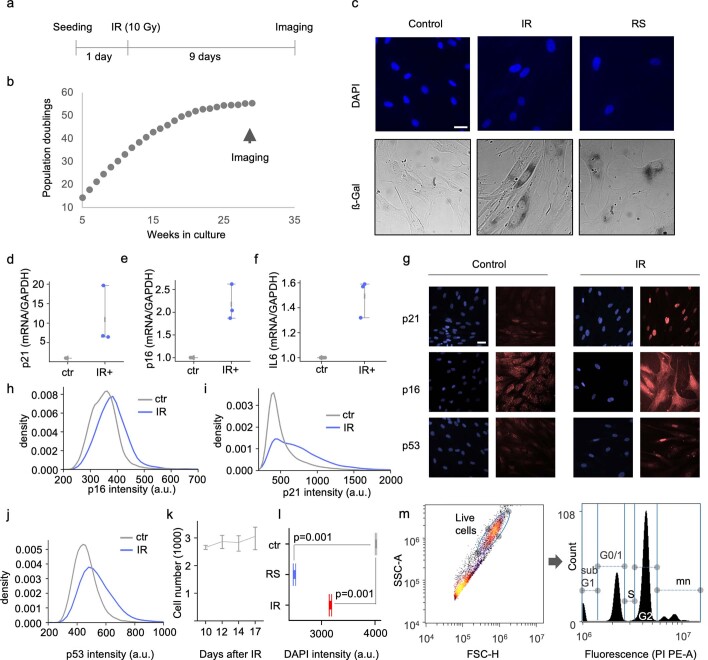
Extended Data Fig. 1. Cell culture models of senescence.
a Schematic of Ionizing radiation (IR)-induced senescence. b Representative growth curve of cells undergoing replicative senescence (RS). c Representative micrographs of SA-β-gal activity and DAPI in control, IR and RS cells; scale bars, 10 μm. d Relative p21 mRNA expression levels by qPCR (n = 3, ± SEM). e Relative p16 mRNA expression by qPCR (n = 3, ± SEM). f Relative IL-6 mRNA expression by qPCR (n = 3, ± SEM). g Representative immunohistochemistry micrographs of nuclei with p21, p16, and p53 staining in control and IR cells; scale bars, 10 μm. h Distribution of p16 intensities for IR and control for three fibroblast cell lines (n = 9,196-27,716). i Distribution of p21 intensities for IR and control for three fibroblast cell lines (n = 13,678-32,730). j Distribution of p53 intensities for IR and control for three fibroblast cell lines (n = 12,844-31,100). k Cell count following irradiation (n = 3 cell lines, mean ± 95% CI). l DAPI intensities for IR, RS, and control for three fibroblast cell lines (RS n = 6,976, IR n = 19,193, control n = 68,971; mean ± 95% CI, two-sided Student’s t-test). m Gating strategy for cell cycle analysis (data shown is for 10 Gy treated fibroblasts), mn: multinucleated cells

