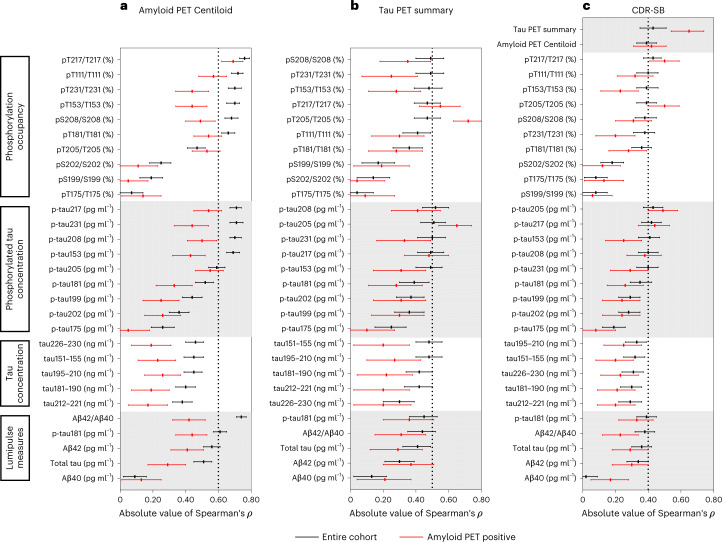
Fig. 1. Correlations of CSF measures with amyloid PET Centiloid, the tau PET summary measure or dementia severity.
a, Correlations of the CSF measures with amyloid PET Centiloid evaluated in the amyloid PET cohort (n = 750 individuals). b, Correlations with the tau PET summary measure evaluated in the tau PET cohort (n = 371 individuals). c, Correlations with dementia severity, as measured by the CDR-SB, evaluated in the larger amyloid PET cohort (n = 750 individuals). The lines represent Spearman’s correlation (middle point) with 95% CIs. The black lines represent correlations in the entire cohort and the red lines represent correlations in amyloid PET-positive individuals.

