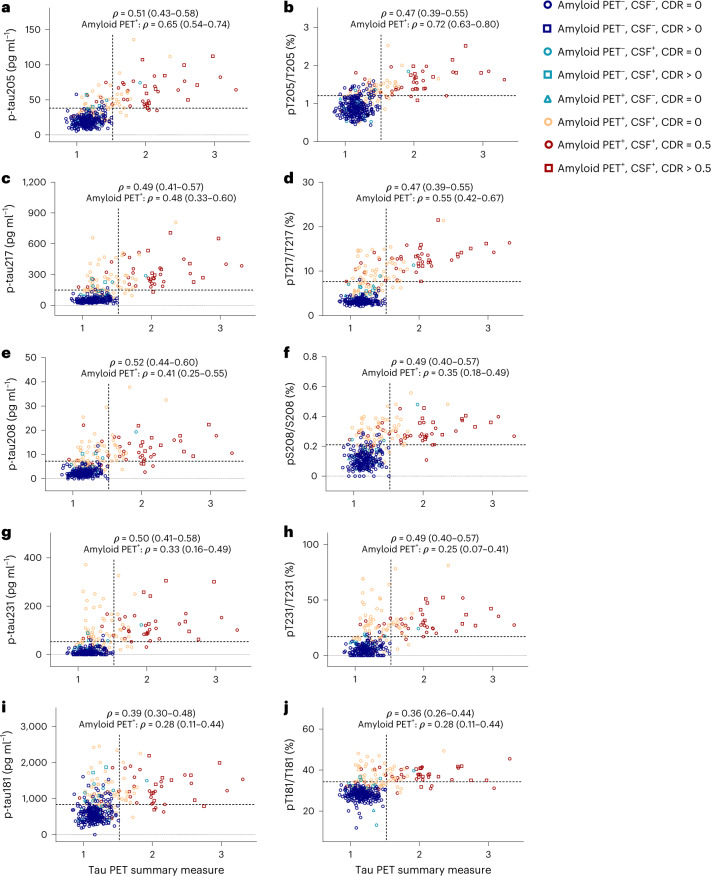
Fig. 3. Correlations of selected CSF p-tau concentrations and tau phosphorylation occupancies with the tau PET summary measure.
a–j, CSF concentrations of p-tau205 (a), p-tau217 (c), p-tau208 (e), p-tau231 (g) and p-tau181 (i), and tau phosphorylation occupancies at T205 (b), T217 (d), S208 (f), T231 (h), and T181 (j), plotted as a function of the tau PET summary measure. Spearman’s correlations with 95% CIs are shown for the entire tau PET cohort (n = 371) and amyloid PET-positive individuals in the tau PET cohort (n = 125). The horizontal dashed lines denote the cut-offs that best distinguish tau PET status, based on combined sensitivity and specificity (Supplementary Table 9). The vertical dashed lines represent the cut-off for tau PET positivity. Each symbol represents one individual: blue circle: amyloid PET negative, CSF negative, CDR = 0; blue square: amyloid PET negative, CSF negative, CDR > 0; green circle: amyloid PET negative, CSF positive, CDR = 0; green square: amyloid PET negative, CSF positive, CDR > 0; green triangle: amyloid PET positive, CSF negative, CDR = 0; orange circle: amyloid PET positive, CSF positive, CDR = 0; red circle: amyloid PET positive, CSF positive, CDR = 0.5; and red square: amyloid PET positive, CSF positive, CDR > 0.5.

