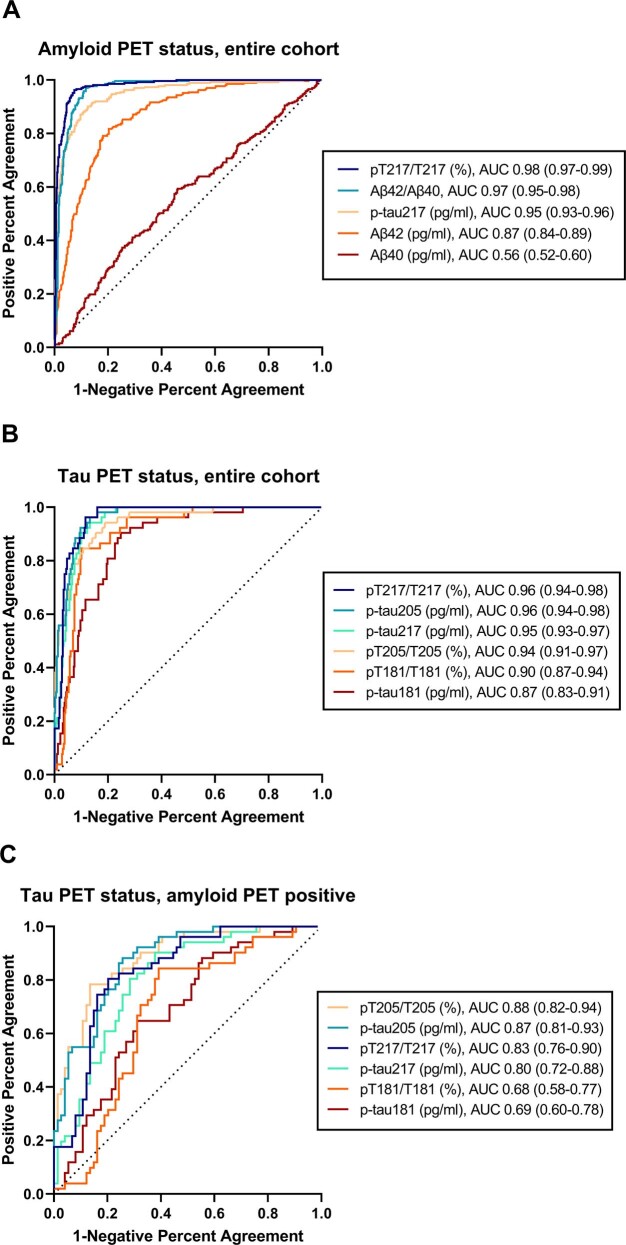
Extended Data Fig. 2. Receiver operating characteristic curves for selected CSF measures.
Correspondence of selected CSF measures with amyloid PET status was evaluated in the amyloid PET cohort; n = 750 for all measures shown (A). Correspondence of selected CSF measures with tau PET status was evaluated in the tau PET cohort; n = 371 for all measures shown except for pT181/T181 and p-tau181 (n = 370) (B). Correspondence of selected CSF measures with tau PET status was evaluated in the amyloid PET positive individuals in the tau PET cohort; n = 125 for all measures shown (C). For each measure, the receiver operating characteristic area under the curve with 95% confidence intervals is shown.

