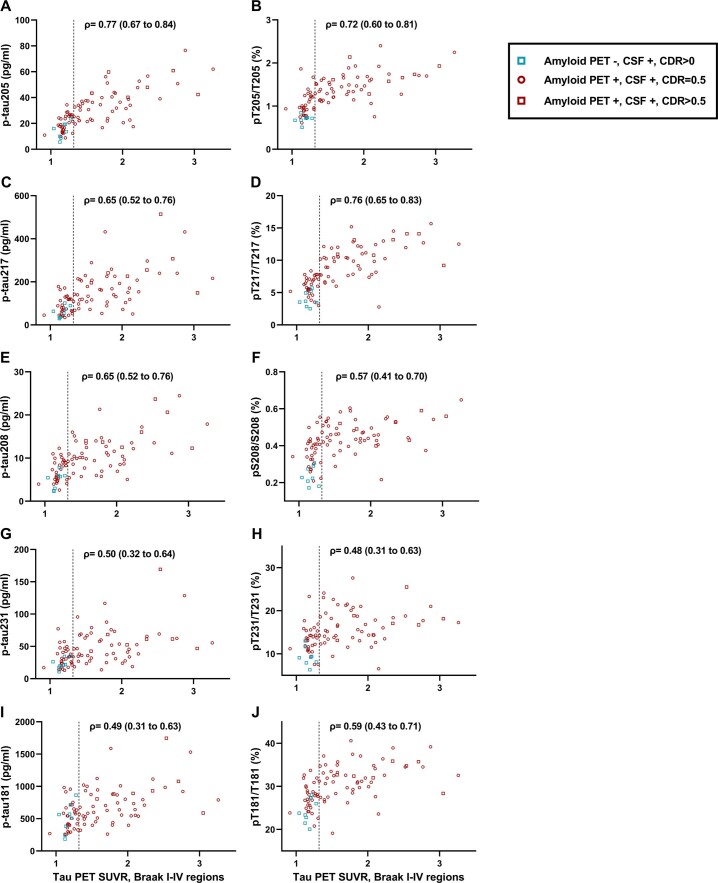
Extended Data Fig. 4. Correlations of selected CSF p-tau concentrations and tau phosphorylation occupancies with tau PET SUVR for Braak I-IV regions in the BioFINDER-2 cohort.
CSF concentrations of p-tau205 (A), p-tau217 (C), p-tau208 (E), p-tau231 (G), and p-tau181 by MS (I) and tau phosphorylation occupancies at T205 (B), T217 (D), S208 (F), T231 (H), as well as T181 (J), are plotted as a function of the tau PET SUVR for Braak I-IV regions. Spearman correlations with 95% confidence intervals are shown. Vertical dashed lines represent the cut-off for tau PET positivity (SUVR > 1.32 for Braak I-IV regions). Each symbol represents one individual: green square: amyloid PET negative, CSF positive, CDR > 0; red circle: amyloid PET positive, CSF positive, CDR = 0.5; red square: amyloid PET positive, CSF positive, CDR > 0.5.

