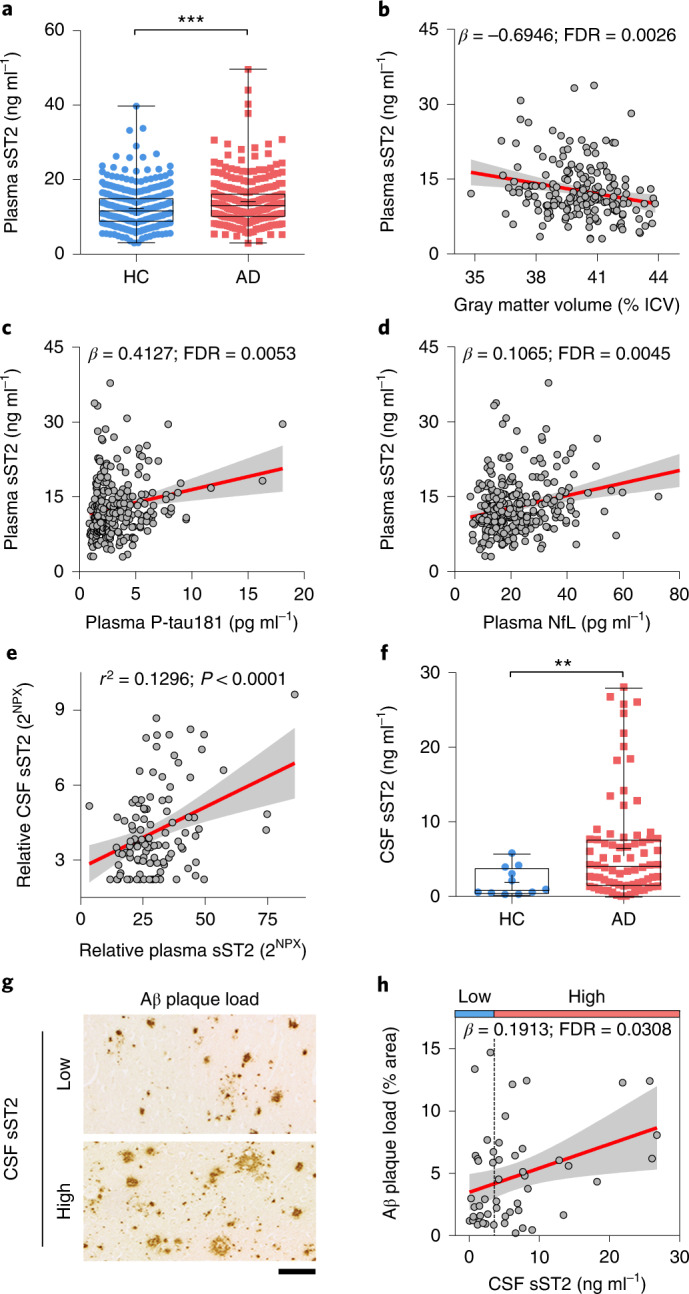
Fig. 1. Soluble ST2 levels are associated with Alzheimer’s disease and its pathological changes.

a, Individual plasma sST2 levels stratified by disease phenotype (n = 336 HCs, n = 277 individuals with AD; Chinese_cohort_1). β = 2.072. b–d, Associations between plasma sST2 level and AD-associated endophenotypes in Chinese_cohort_1. b, The intracranial volume (ICV)-normalized gray matter volume (n = 192). c, plasma P-tau181 levels (n = 290). d, plasma NfL levels (n = 289). e, Correlation between CSF and plasma levels of sST2 (n = 66 HCs, n = 23 individuals with MCI, and n = 18 individuals with AD; ADRC cohort). Linear regression test, adjusted for age, sex and disease diagnosis. β = 0.049; r2, Pearson’s correlation coefficient. 2NPX, linear form of normalized protein expression level. f, Individual CSF sST2 levels stratified by disease phenotype (n = 11 HCs, n = 75 individuals with AD; UKBBN cohort). β = 6.605. g,h, Associations between Aβ staining in the postmortem frontal cortex and CSF sST2 levels in individuals with AD (n = 51 individuals; UKBBN cohort). Individuals were stratified into two groups according to CSF sST2 levels: low, ≤3.6 ng ml−1; high, >3.6 ng ml−1. The vertical dashed line in h indicates the CSF sST2 level (3.6 ng ml−1) with the largest Youden’s index value for distinguishing HCs from individuals with AD. Representative images of Aβ staining in individuals with AD who had low and high CSF sST2 levels (g) and association analysis results (h). Scale bar, 100 μm. Data in box-and-whisker plots are presented with maximum, 75th percentile, median, 25th percentile and minimum values; plus signs denote mean values; data in regression lines are presented as the slope (red) and 95% confidence intervals (CIs; gray). Statistical tests for plasma sST2 were performed by linear regression analysis, adjusted for age, sex, CVD status, BMI and education level, with multiple testing correction. Statistical tests for CSF sST2 were performed by linear regression analysis, adjusted for age, sex and PMD, with multiple testing correction. *FDR < 0.05, **FDR < 0.01, ***FDR < 0.001.
