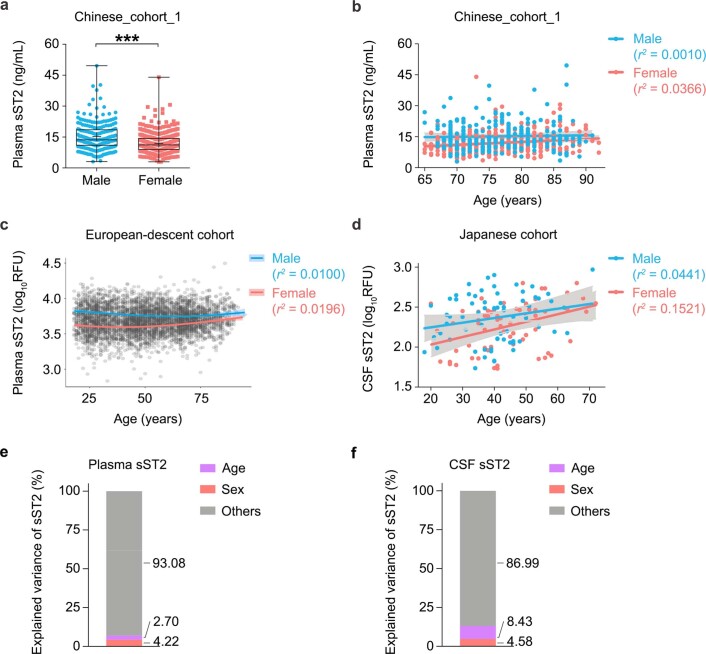
Extended Data Fig. 4. Effects of sex and age on soluble ST2 levels.
(a) Individual plasma sST2 levels stratified by sex (n = 216 males, and 397 females from Chinese_cohort_1). β = −3.577 for females vs. males, P = 1.58E − 12. (b) Associations between plasma sST2 levels and age in males and females (n = 216 males, and 397 females from Chinese_cohort_1). Test in males: β = 0.0134, Pearson’s r2 = 0.0010, P = 0.8661; test in females: β = 0.1256, Pearson’s r2 = 0.0366, P = 0.0016. (c) Correlations between plasma sST2 level and age in males and females from the INTERVAL and LonGenity cohort (n = 1,685 males, and 1,616 females from INTERVAL cohort; n = 432 males, and 530 females from LonGenity cohort). Test in INTERVAL cohort (ages 18–76), males: Pearson’s r2 = 0.0169, P < 0.0001; females: Pearson’s r2 = 0.0001, P = 0.7715. Test in LonGenity cohort (ages 65–94), males: Pearson’s r2 = 0.0100, P = 0.0093; females: Pearson’s r2 = 0.0196, P = 0.0001. (d) Correlations between CSF sST2 level and age in males and females from the Japanese cohort (n = 68 males, n = 65 females). Test in males: Pearson’s r2 = 0.0441, P = 0.0812; test in females: Pearson’s r2 = 0.1521, P = 0.0014. (e, f) Contributions of age and sex to the variance of sST2 levels. Numbers denote the proportions of plasma sST2 (e) and CSF sST2 (f) variance explained by age, sex, and other factors in the Chinese_cohort_1 and Japanese cohort, respectively. Data in box-and-whisker plots are presented with maximum, 75th percentile, median, 25th percentile, and minimum values; plus signs (+) denote mean values; data in regression lines are presented as slope (red/blue) and 95% CIs (gray). Statistical tests were performed by linear regression analysis, additionally adjusted for AD diagnosis, CVD status, BMI, education level in the Chinese_cohort_1. *P < 0.05, **P < 0.01, ***P < 0.001.

