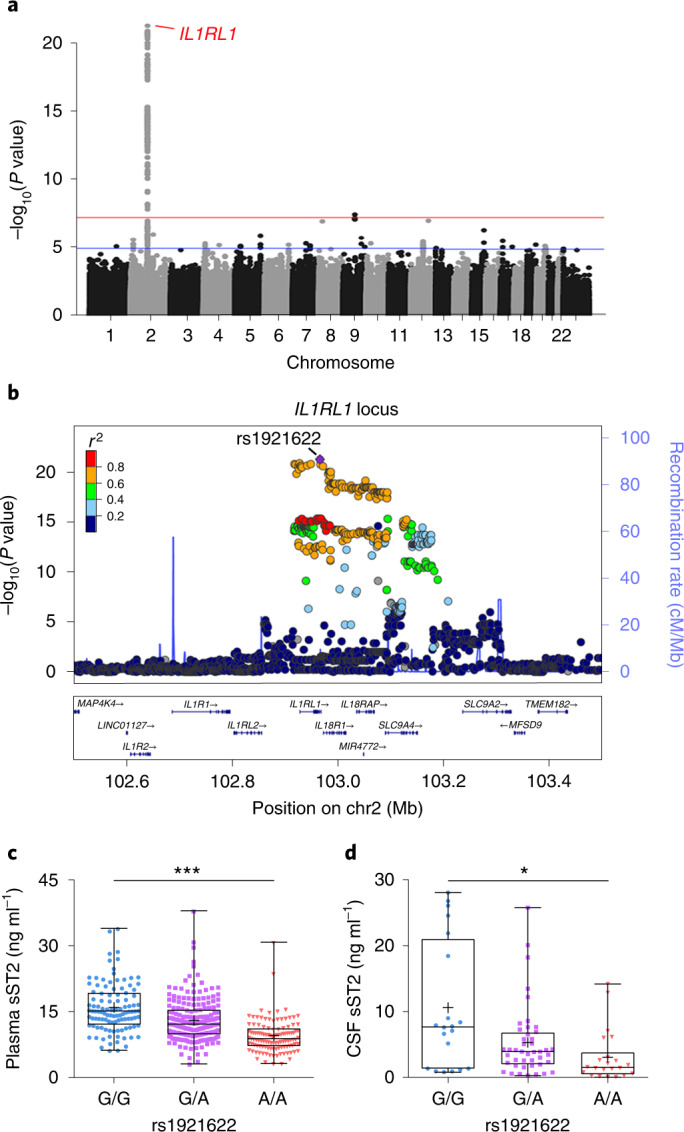
Fig. 2. The rs1921622 A allele is associated with lower soluble ST2 level.

a, Manhattan plot showing genetic variants at the IL1RL1 locus that are associated with plasma sST2 level, as identified by a GWAS of plasma sST2 levels in Chinese_cohort_1. Horizontal lines indicate the suggestive threshold (P = 1 × 10⁻⁵, blue) and genome-wide threshold (P = 5 × 10⁻⁸, red). Linear regression test, adjusted for age, sex, AD diagnosis and population structure. b, Regional association plot of genetic variants at the IL1RL1 locus and plasma sST2 level. The purple diamond indicates the sentinel variant rs1921622. The color scale indicates the linkage disequilibrium (LD; measured as r2) between rs1921622 and its neighboring variants. c,d, Plasma (c) and CSF (d) sST2 levels in individuals stratified by rs1921622 genotype. Measurement of plasma sST2 level (n = 107, 206 and 114 G/G, G/A and A/A carriers, respectively; Chinese_cohort_1). Linear regression test, adjusted for age, sex, AD diagnosis and population structure; β = −3.346, P = 5.35 × 10⁻²². Measurement of CSF sST2 level (n = 20, 44 and 22 G/G, G/A and A/A carriers, respectively; UKBBN cohort). Linear regression test, adjusted for age, sex, AD diagnosis and PMD; β = −2.244, P = 1.06 × 10⁻². Data in box-and-whisker plots include maximum, 75th percentile, median, 25th percentile and minimum values; plus signs denote corresponding mean values. *P < 0.05, **P < 0.01, ***P < 0.001.
