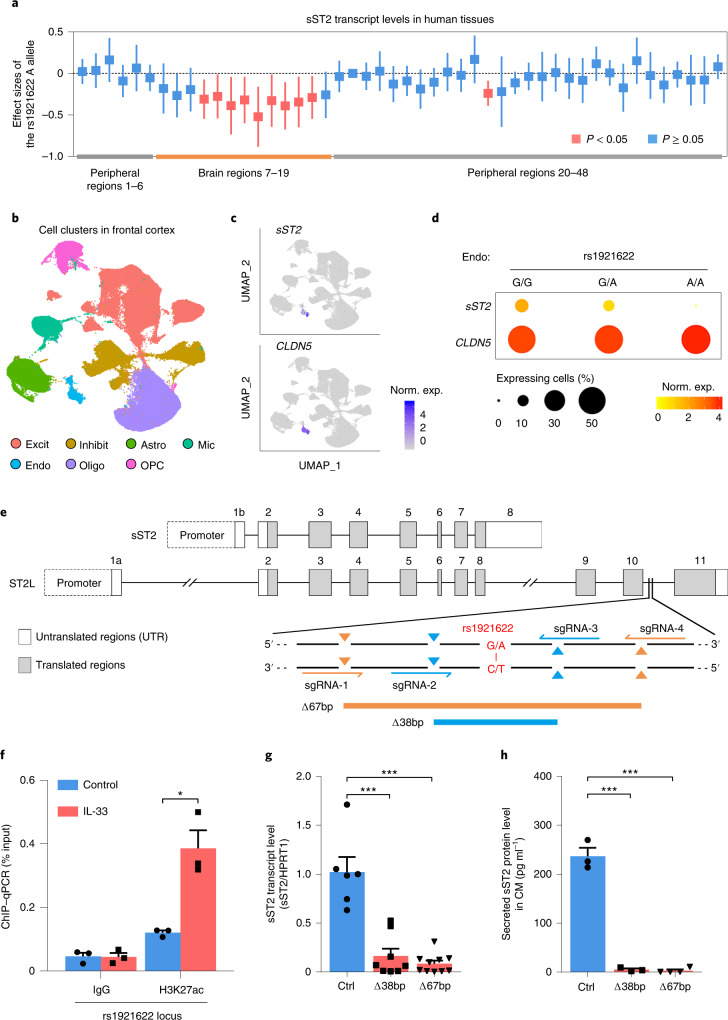
Fig. 3. Target deletion at rs1921622 decreases soluble ST2 expression and secretion in brain endothelial cells.
a, Effects of rs1921622 on sST2 transcript levels in human tissues. Boxes and lines indicate the effect size and 95% CIs of the rs1921622 A allele for each tissue, respectively (Supplementary Table 4). Red and blue indicate significant (P < 0.05) and nonsignificant (P ≥ 0.05) associations, respectively. Linear regression test, adjusted for age, sex, RNA integrity and population structure. b–d, snRNA-seq analysis revealed an association between rs1921622 and sST2 transcript level in brain endothelial cells. b, Uniform manifold approximation and projection (UMAP) plot showing cell types in the human frontal cortex (n = 169,496 cells from 21 individuals; UKBBN cohort). Excit, excitatory neurons; Inhibit, inhibitory neurons; Astro, astrocytes; Mic, microglia; Endo, endothelial cells; Oligo, oligodendrocytes; OPCs, oligodendrocyte progenitor cells. c,d, Expression profiles (c) and dot plots (d) of sST2 and CLDN5 transcripts in the endothelial cells, stratified by rs1921622 genotype. Norm. exp., normalized expression. e, CRISPR–Cas9 genome-editing strategy and locations of the two single-guide RNA (sgRNA) pairs for 67-bp deletion (Δ67 bp) and 38-bp deletion (Δ38 bp) targeting the rs1921622-harboring region (red). f, H3K27ac analysis of the rs1921622 locus in hCMEC/D3 cells after IL-33 administration for 24 h (n = 3 per group). T = 4.593, P = 1.01 × 10⁻². g,h, Deletion of the rs1921622 locus decreases transcript level and protein secretion of sST2 in hCMEC/D3 cells. g, sST2 transcript levels (n = 6, 8 and 10 clones for isogenic control, Δ38 bp and Δ67 bp, respectively). For Δ38 bp versus control, T = − 5.444, P = 1.00 × 10⁻⁴; Δ67 bp versus control, T = − 7.612, P < 1.00 × 10⁻⁴. h, Levels of sST2 protein in conditioned medium (CM; n = 3, 3 and 4 clones for isogenic control, Δ38 bp and Δ67 bp, respectively). For Δ38 bp versus control: T = −13.450, P = 2.00 × 10⁻⁴; Δ67 bp versus control: T = −16.030, P < 1.00 × 10⁻⁴. Data in bar charts are the mean + s.e.m. Statistical tests for f–h were performed as two-sided unpaired Student’s t-tests. *P < 0.05, **P < 0.01, ***P < 0.001.

