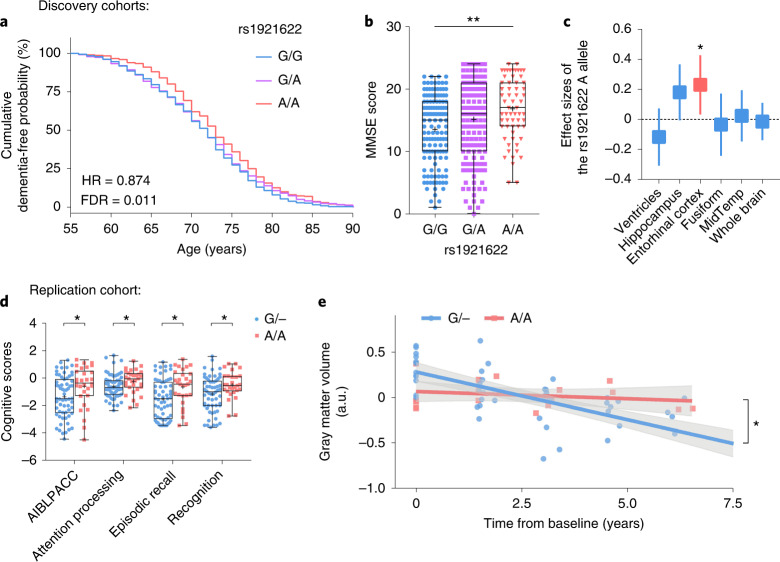
Fig. 5. The rs1921622 A allele is associated with changes of Alzheimer’s disease-related endophenotypes in female APOE-ε4 carriers.
a, Cumulative dementia-free probability in female APOE-ε4 carriers with AD stratified by rs1921622 genotype (n = 314, 568 and 300 G/G, G/A and A/A carriers, respectively; LOAD and ADC1–3 cohorts). Cox regression test, adjusted for population structure, with multiple testing correction. b, Individual Mini-Mental State Exam (MMSE) scores of female APOE-ε4 carriers with AD stratified by rs1921622 genotype (n = 131, 158 and 61 G/G, G/A and A/A carriers, respectively; Chinese_cohort_2). Linear regression test, adjusted for age and population structure, with multiple testing correction. β = 1.622. c, Effect size of the rs1921622 A allele on brain region volume in female APOE-ε4 carriers with cognitive impairment (n = 38, 86 and 57 G/G, G/A and A/A carriers, respectively; ADNI cohort). Linear regression test, adjusted for age, ICV, magnetic resonance imaging (MRI) platforms, dementia stages and population structure, with multiple testing correction. Data are presented as effect sizes (boxes) and 95% CIs (lines). Red and blue indicate significant (FDR < 0.05) and nonsignificant (FDR ≥ 0.05) associations, respectively. Fusiform, fusiform gyrus; MidTemp, middle temporal gyrus. d, Individual cognitive scores in female Aβ+ APOE-ε4 carriers stratified by rs1921622 genotype (n = 59 G carriers (G/−), n = 29 A/A carriers; AIBL cohort). Wilcoxon rank-sum test, with multiple testing correction. W = 1087.0, 1115.5, 1083.0 and 916.5 for AIBLPACC, attention processing, episodic recall and recognition scores, respectively. e, Longitudinal gray matter volume in female Aβ+ APOE-ε4 carriers stratified by rs1921622 genotype (n = 50 and 19 data points from 12 G carriers (G/−) and 5 A/A carriers, respectively; AIBL cohort). Linear mixed model test; adjusted for baseline age and MRI scanners, with multiple testing correction. β = −0.159 (G/−) and −0.027 (A/A); F = 8.804. Data in box-and-whisker plots are presented with maximum, 75th percentile, median, 25th percentile and minimum values; plus signs denote mean values; data in regression lines are presented as the slope (red/blue) and 95% CIs (gray). *FDR < 0.05, **FDR < 0.01, ***FDR < 0.001. a.u., arbitrary units.

