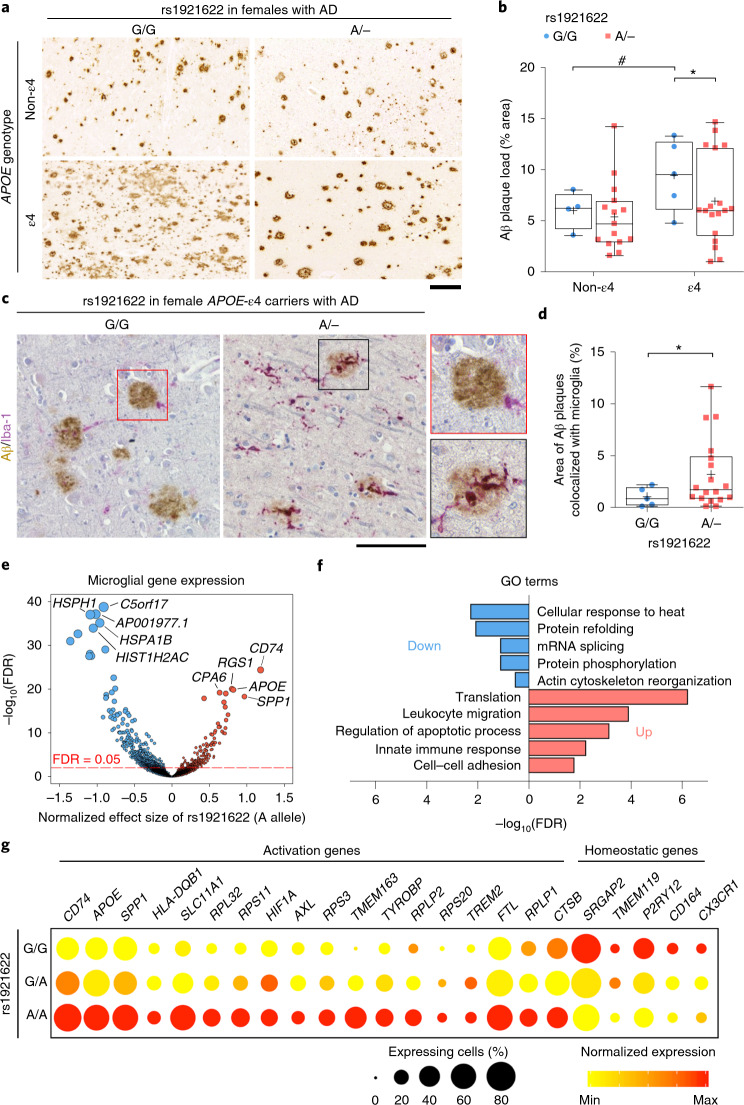
Fig. 6. The rs1921622 A allele enhances microglial activities toward Aβ in female APOE-ε4 carriers with Alzheimer’s disease.
a,b, Representative images (a) and quantification (b) showing Aβ plaque area in the frontal cortices of females with AD stratified by APOE-ε4 and rs1921622 genotypes (n = 4 G/G carriers and 15 A carriers (A/−) among APOE-ε4 noncarriers (non-ε4); n = 5 G/G carriers and 18 A/− carriers among APOE-ε4 carriers (ε4); UKBBN cohort). Test for effects of APOE-ε4: β = 3.448 (G/G) and 1.549 (A/−), P = 4.83 × 10⁻² (G/G) and 2.54 × 10⁻¹ (A/−); test for effects of rs1921622, β = 0.288 (non-ε4) and −2.262 (ε4), P = 7.02 × 10⁻¹ (non-ε4) and 3.71 × 10⁻² (ε4). Scale bar, 200 μm. c,d, Representative images (c) and quantification (d) showing colocalization between Aβ plaques (brown) and Iba-1+ microglia (purple) in the frontal cortices of female APOE-ε4 carriers with AD stratified by rs1921622 genotype (n = 5 G/G carriers, n = 18 A/− carriers; UKBBN cohort). β = 2.017, P = 2.53 × 10⁻². Scale bar, 100 μm. e, Volcano plot showing the associations between rs1921622 and microglial genes in the frontal cortices of female APOE-ε4 carriers with AD (n = 2,636 microglia of eight individuals; UKBBN cohort). Blue and red dots indicate microglial genes that were negatively and positively associated with the rs1921622 A allele, respectively. Dot size is proportional to FDR (log10 scale). The top five negatively and positively associated genes are labeled. f, Representative GO terms enriched in the rs1921622-associated microglial genes. Blue and red indicate GO terms enriched for the downregulated and upregulated genes, respectively, in rs1921622 A allele carriers. g, Dot plot showing the expression levels of microglial activation genes and homeostatic genes stratified by rs1921622 genotype. Data in box-and-whisker plots are presented with maximum, 75th percentile, median, 25th percentile and minimum values; plus signs denote mean values. Statistical tests were performed by linear regression analysis, adjusted for age and PMD. *P < 0.05, **P < 0.01, ***P < 0.001; #P < 0.05, ##P < 0.01, ###P < 0.001.

