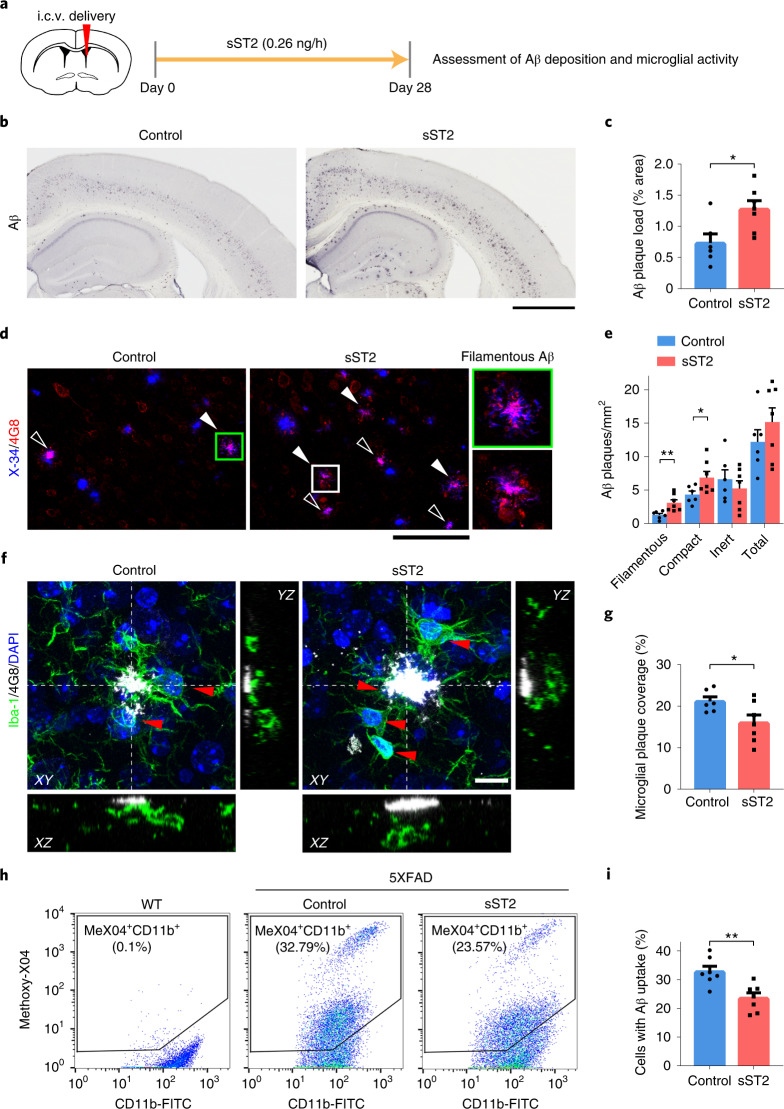
Fig. 7. Increased brain soluble ST2 levels exacerbate Aβ accumulation and impair microglial Aβ clearance in female 5XFAD mice.
a, Intracerebroventricular (i.c.v.) delivery of sST2 to 3-month-old 5XFAD mice. b–e, Aβ deposition in the cortices of 4-month-old female 5XFAD mice after i.c.v. delivery of sST2-Fc or Fc as a control. b,c, Representative images (b) and quantification (c) of Aβ plaques (percentage of total cortical area; control n = 6 mice, sST2 n = 7 mice). T = 2.758, P = 1.86 × 10⁻². Scale bar, 1 mm. d, Confocal images of X-34-stained (blue) and 4G8-labeled (red) Aβ. Filamentous (filled arrowheads) and compact (hollow arrowheads) Aβ plaques. Scale bar, 100 μm. e, Quantification of filamentous, compact, inert and total Aβ plaques (control n = 6 mice, sST2 n = 7 mice). T = 3.235, 2.274, −0.770 and 1.050, respectively; P = 7.95 × 10⁻³, 4.40 × 10⁻², 4.57 × 10⁻¹ and 3.16 × 10⁻¹, respectively. f, Merged confocal z-stack images with orthogonal X–Z and Y–Z views showing co-staining of 4G8-labeled Aβ plaques (white) and Iba-1+ microglia (green; red arrowheads indicate microglial soma) in the cortices of 4-month-old female 5XFAD mice after i.c.v. delivery of sST2-Fc or Fc as a control (single-channel images in Supplementary Fig. 7). Scale bar, 10 μm. g, Quantification of microglial coverage of Aβ plaques (control n = 6 mice, sST2 n = 7 mice). T = −2.298, P = 4.22 × 10⁻². h,i, Microglial Aβ uptake activity in the cortices of 4-month-old female 5XFAD mice after i.c.v. delivery of sST2-Fc or Fc as a control. Representative scatterplots (h) and quantification (i) show the percentages of CD11b+ cells containing methoxy-X04-labeled Aβ (control n = 7 mice, sST2 n = 7 mice; gating strategy in Supplementary Fig. 8). T = −3.620, P = 3.50 × 10⁻³. The scatterplots of wild-type (WT) mice in h were used to gate methoxy-X04+ microglia (that is, MeX04+CD11b+ cells). Data in bar charts are the mean + s.e.m. Statistical tests were performed as two-sided unpaired Student’s t-tests. *P < 0.05, **P < 0.01, ***P < 0.001.

