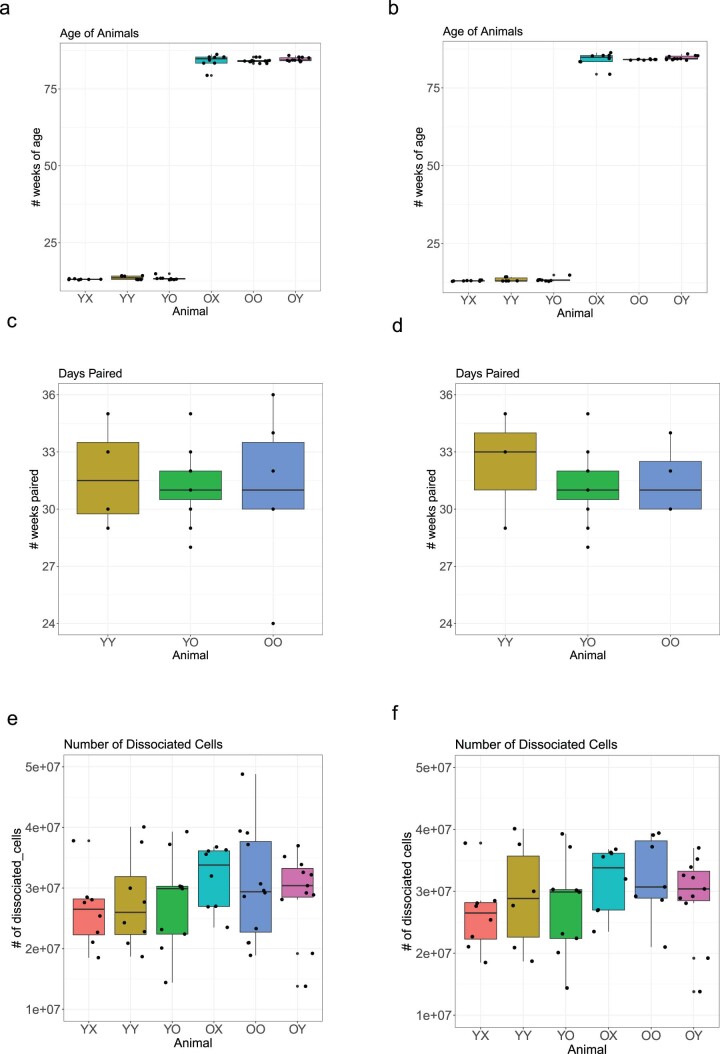
Extended Data Fig. 2. Sample metrics.
Profiling of animals and their derived brain cells used for sequencing, before (N = 56) (a,c,e) and after (n = 50) (b,d,f) quality control filtering in which certain animals were omitted (see Methods). Boxplot minimum is the smallest value within 1.5 times the interquartile range below the 25th percentile, maximum is the largest value within 1.5 times the interquartile range above the 75th percentile. Boxplot center is the 50th percentile (median), box bounds are the 25th and 75th percentile. Outliers are >1.5 times and < 3 times the interquartile range. a-b. Age of mice in weeks prior to parabiosis surgeries. c-d. Number of days joined across parabiotic pairs. e-f. Number of dissociated cells analyzed per brain across all animal types.

