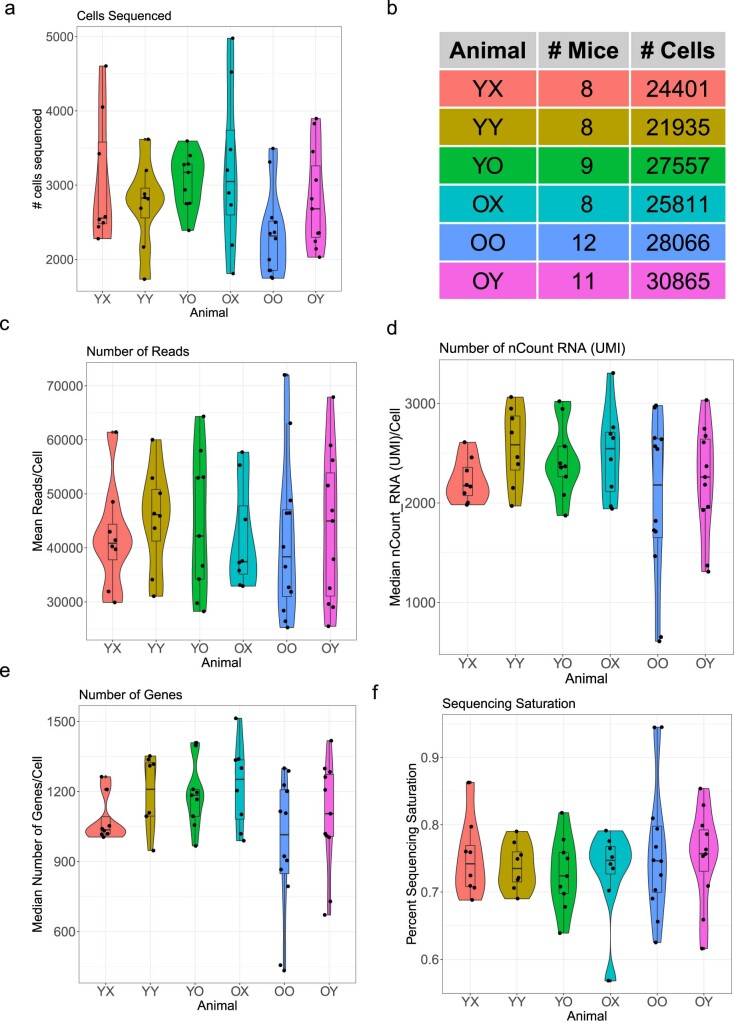
Extended Data Fig. 3. Sequencing metrics.
Violin plots with boxplots showing sequencing metrics of the distribution of animals from all sequenced animal types. Each dot represents one animal. Boxplot minimum is the smallest value within 1.5 times the interquartile range below the 25th percentile, maximum is the largest value within 1.5 times the interquartile range above the 75th percentile. Boxplot center is the 50th percentile (median), box bounds are the 25th and 75th percentile. Outliers are >1.5 times and < 3 times the interquartile range. a. Number of cells sequenced by animal. b. Table of total number of animals and cells analyzed. c. Mean number of mapped reads per cell by animal. d. Median number of nCount RNA (UMI) detected per cell by animal. e. Median number of genes detected per cell by animal. f. Percent of sequencing saturation by animal.

