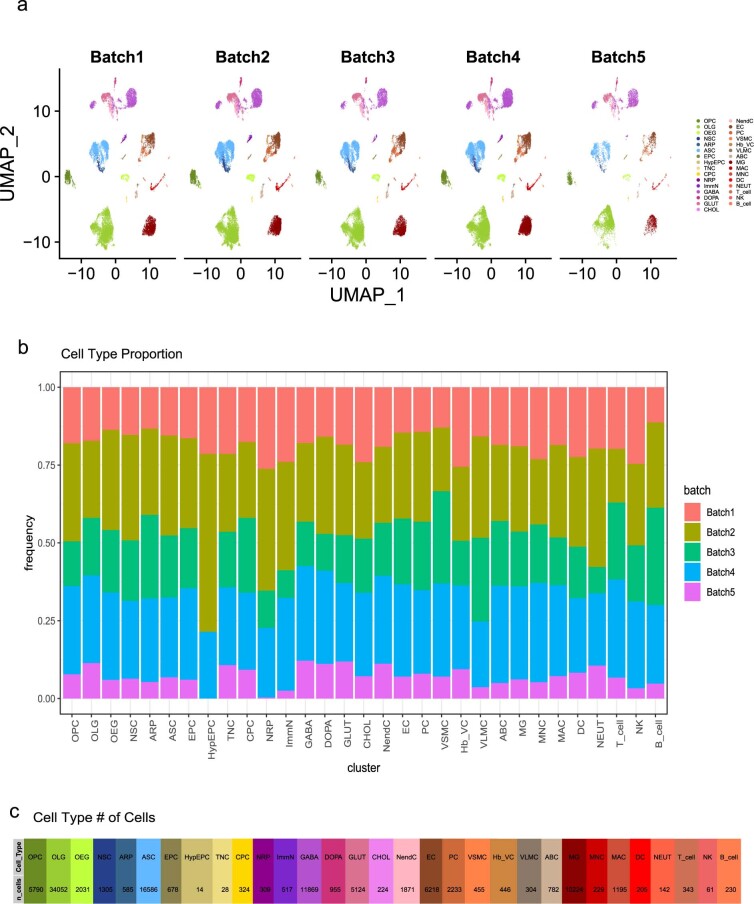
Extended Data Fig. 4. Distribution of 50 animals across 5 sequencing batches, with respect to cell clusters, and cell count.
a. UMAP projection of color-coded batches over clusters that passed filtering criteria. b. Frequency of each color-coded batch representation in each cell type. All cell types are represented by cells from all batches, except for HypEPC in batch 5, probably due to its small size. c. Number of detected cells in each cell type.

