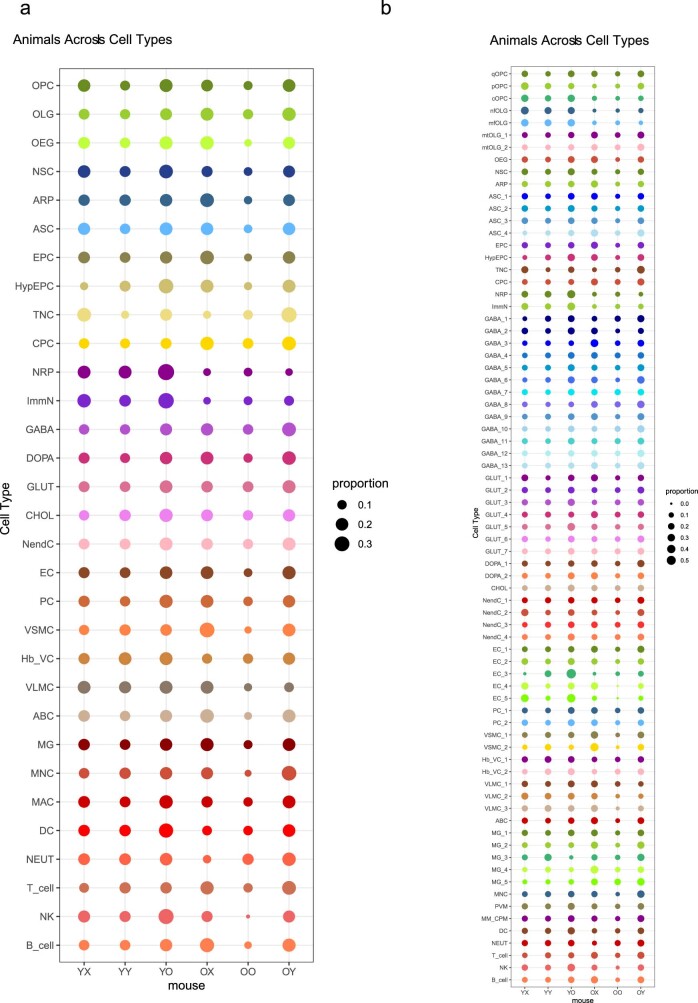
Extended Data Fig. 6. Representation of each animal type’s distribution within each cell type.
a. Dot plot representation of each cell type’s representation by each animal type. Size of the dot is proportional to the number of cells contributed by each animal type within a cell type. b. Dot plot representation of each subpopulation’s representation by each animal type. Size of the dot is proportional to the number of cells contributed by each animal type within a subpopulation.

