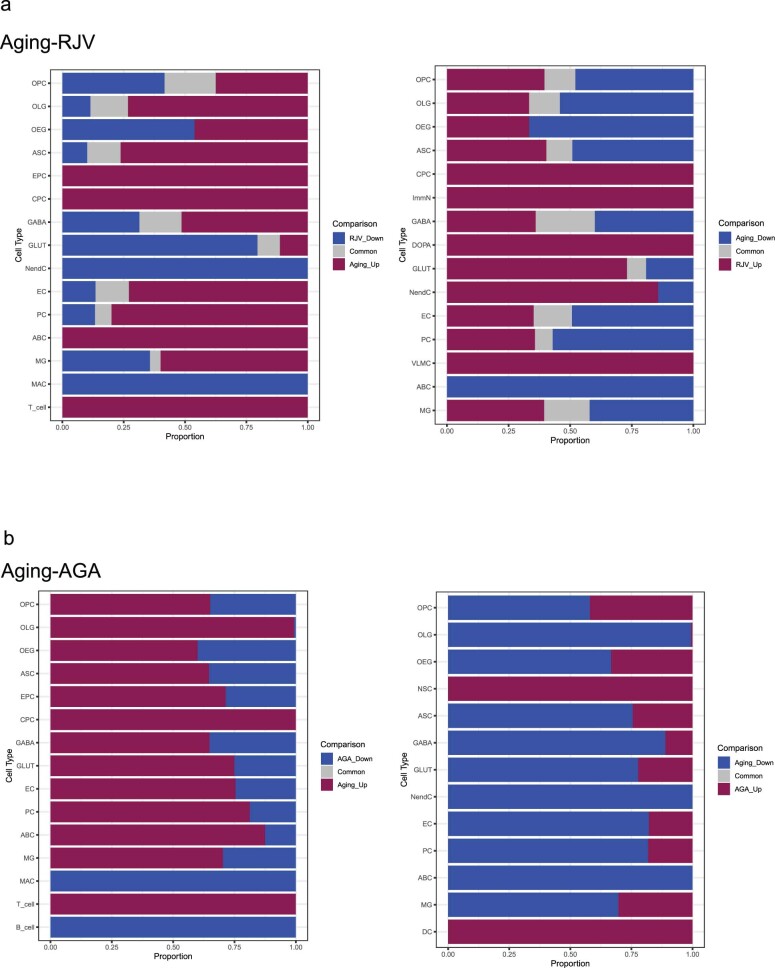
Extended Data Fig. 9. Composition of DGEs per cell type between Aging-RJV, and Aging-AGA.
a. Bar graph of each cell type’s total FDR ≤ 0.05 DGEs split by logFC direction. The proportion of DGEs reflecting Aging and RJV is depicted, as well as the fraction of overlapping signatures (intersection in grey). b. Bar graph of each cell type’s total FDR ≤ 0.05 DGEs split by logFC direction. The proportion of DGEs reflecting Aging and AGA is depicted, as well as the fraction of overlapping signatures (intersection in grey).

