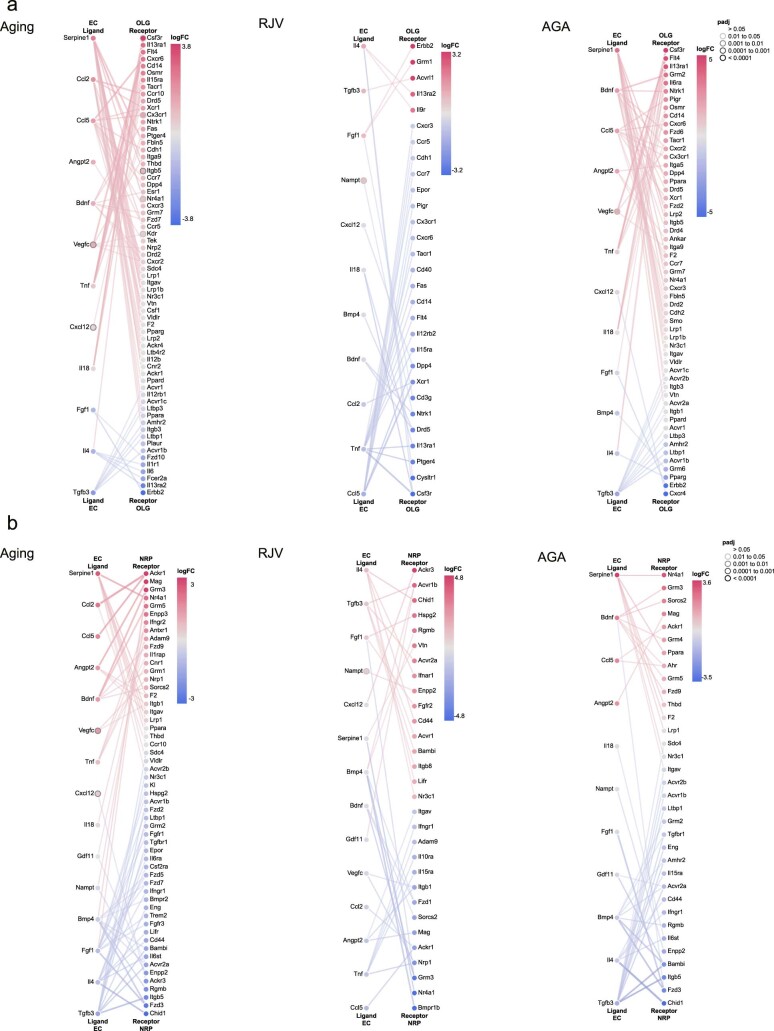
Extended Data Fig. 10. Intercellular communication networks between EC-OLG and EC-NRP revealed aging-related interactions that were modified by heterochronic parabiosis.
Canonical EC ligands and their cognate receptors in OLG (a) or in NRP (b) are shown in each paradigm (Aging, RJV, AGA). In all panels of ligand-receptor interactions, node color represents the magnitude of the DGE (logFC as estimated by DGE) such that the most significantly up-regulated genes are in magenta, and the downregulated genes are in blue. Node borders indicate multiple testing corrected Benjamini-Hochberg FDR for statistical significance of DGE as calculated by edgeR. Edge color represents the sum of scaled differential expression magnitudes from each contributing node, while width and transparency are determined by the magnitude of the scaled differential expression (see details in the Methods section).

