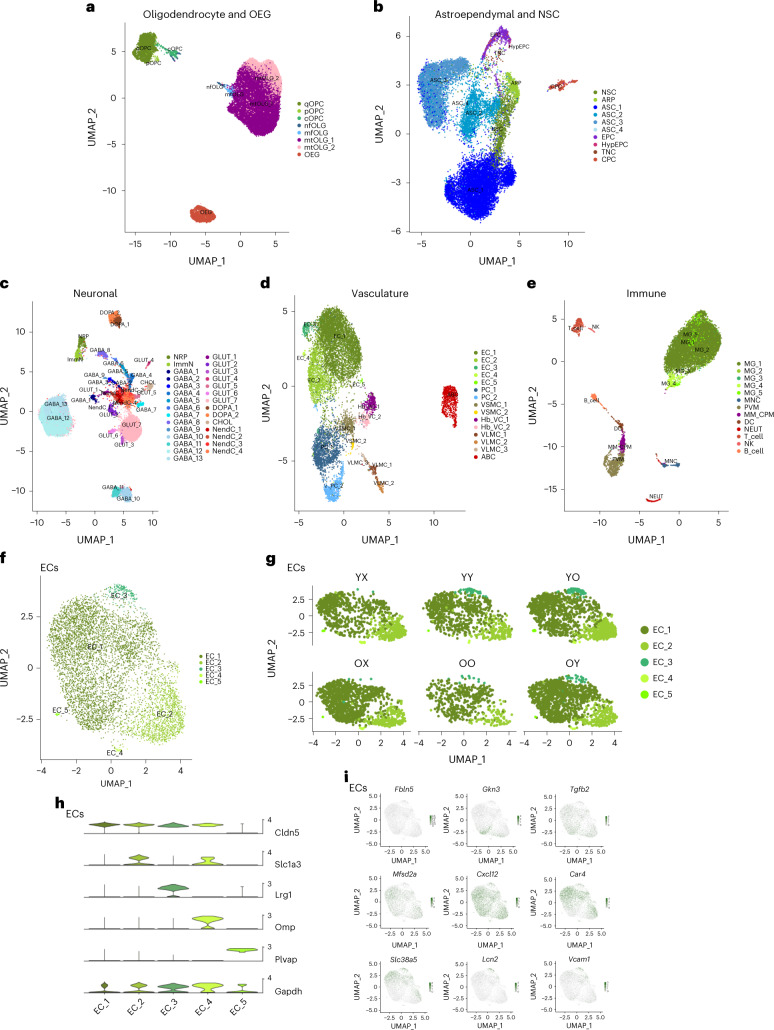
Fig. 2. Characterization of cell types and subpopulations.
a–e, Subpopulation analysis of cell types grouped in five distinct cell classes: OLG lineage and OEGs (n = 41,873 cells) (a), astroependymal cells and NSCs (n = 19,520 cells) (b), neuronal lineage (n = 20,869 cells) (c), vasculature cells (n = 10,438 cells) (d) and immune cells (n = 12,629 cells) (e). q, quiescent; p, proliferating; c, committed, nf, newly formed; mf, myelin-formin; mt, mature. f, UMAP subpopulation analysis of EC clusters (n = 6,218 cells). g, UMAP subpopulation of EC clusters, stratified by animal type. h, Violin plot of delineating markers of ECs, as Cldn5, Slc1a3, Lrg1, Omp and Plvap. i, UMAP overlay of EC zonation markers along the arteriovenous axis curated from the literature41–43. Markers in left-to-right order: large arteries: Fbln5; arterial: Gkn3; capillary–arterial: Tgfb2; capillary: Mfsd2a; capillary: Cxcl12; capillary–venous: Car4; venous: Slc38a6; large veins: Lcn2; and large vessels: Vcam1.

