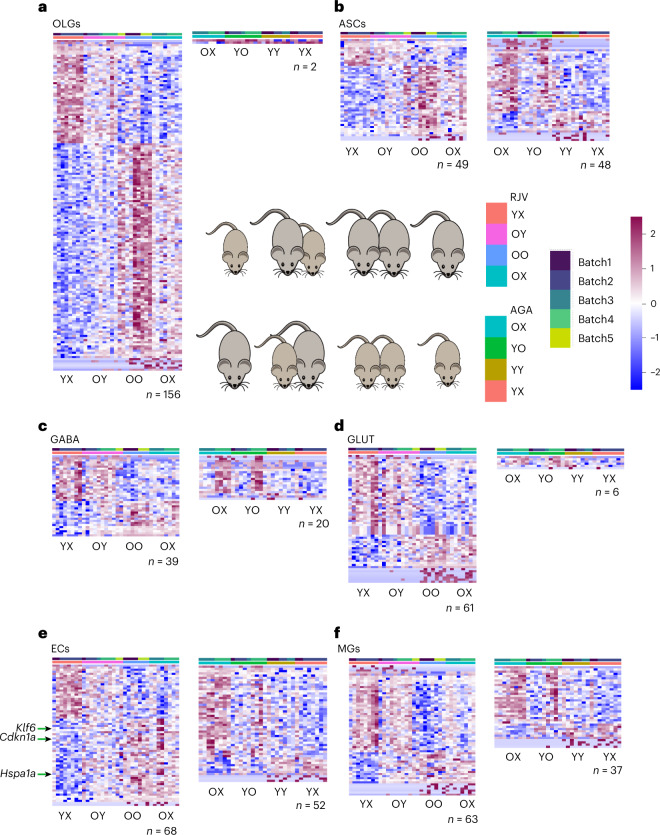
Fig. 3. DGE across major cell types revealed RJV DGEs and aging AGA genes.
a–f, An FDR ≤ 0.05 was used to identify significant DGE genes, with n denoting the total number of genes meeting this threshold. The RJV framework depicts normalized gene expression changes across YX, OY, OO and OX. The AGA framework depicts normalized gene expression changes across OX, YO, YY and YX. DGE genes are log2(z-scored) scaled across rows (all animals) and are ordered by descending log(FC), with OLGs (n = 156 RJV and n = 2 AGA) (a), ASCs (n = 49 RJV and n = 48 AGA) (b), GABA (n = 39 RJV and n = 20 AGA) (c), GLUT (n = 61 RJV and n = 6 AGA) (d), ECs (n = 68 RJV and n = 52 AGA) (e) and MGs (n = 63 RJV and n = 37 AGA) (f) in respective order. The color bar of the heatmap reflects the z-score, from negative (blue) to positive (magenta). The batch is denoted in the top annotation bar and animal type in the second annotation bar.

