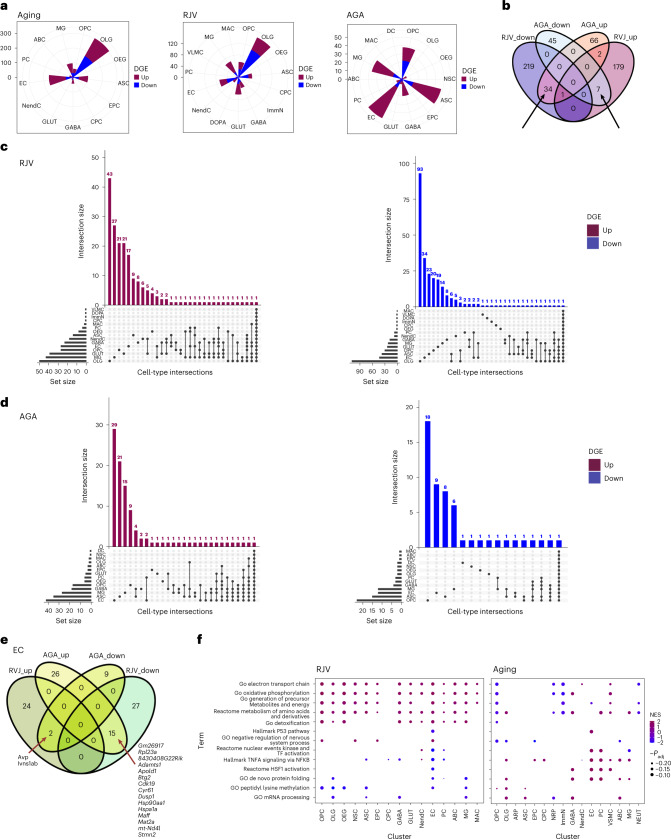
Fig. 4. DGE characterization across cell types.
a, Rose diagrams (circular histograms of number of DGEs) of aging, RJV and AGA across all cell types at FDR ≤ 0.05, colored by direction of log(FC) (up magenta, down blue). b, Venn diagram of RJV and AGA DGEs across all cell types, demonstrating bidirectional log(FC) changes between the comparisons (depicted with arrows). c,d, Upset plot of FDR = 0.05 DGE with positive log(FC) (upregulation) and negative log(FC) (downregulation) in both RJV (c) and AGA (d). The top bar height reflects the number of DGEs in the intersection (in common between the barbells below), and the side bar width reflects the magnitude of the set size. e, EC RJV and AGA DGE Venn diagram split by log(FC) sign, revealing genes that reverse direction between comparisons. The arrows point to listed bidirectional genes. f, GSEA dot plots (Benjamini–Hochberg-adjusted P value for multiple comparisons (Padj) ≤ 0.25) of representative terms across cell types in RJV and aging, with the size of dot proportional to inverse Padj and color by NES from negative (blue) to positive (magenta).

