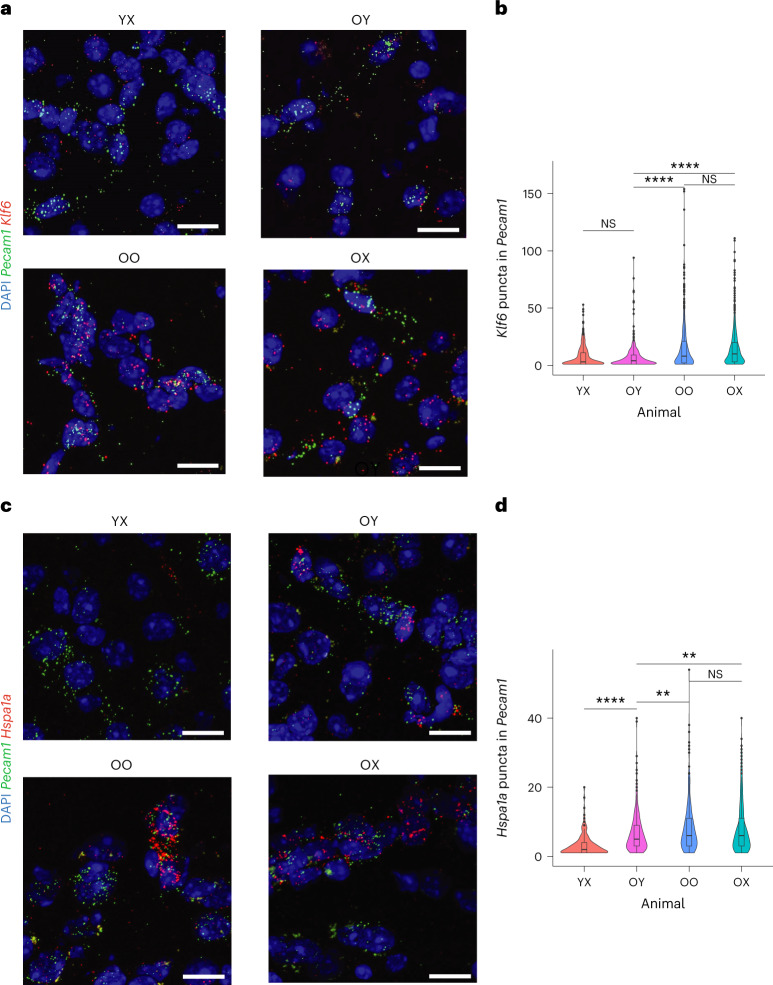
Fig. 5. RNA in situ hybridization assays showing aging and RJV reversal of key aging-associated genes.
a, Representative RNA images of mouse cortices showing Klf6 puncta in Pecam1+ ECs in YX, OY, OO and OX mice. Scale bars, 20 µm. b, Violin and boxplot representation of RNA quantification (n = 3 biologically independent animals) by two-tailed Welch’s t-test with no multiple comparison adjustment for significance. P values for OY–YX: 0.473 (95% confidence interval (CI) −1.588, 0.737); OY–OO: 5.328 × 10⁻¹⁹ (95% CI −10.260, −6.620), OY–OX: 4.900 × 10⁻²⁸ (95% CI −8.881, −6.244); OO–OX: 0.349 (95% CI −0.960, 2.714). Nonsignificant (NS) P > 0.05, *P ≤ 0.05, **P ≤ 0.01, ***P ≤ 0.001, ****P ≤ 0.0001. Boxplot minimum is the smallest value within 1.5× the IQR below the 25th percentile and maximum is the largest value within 1.5× the IQR above the 75th percentile. Boxplot center is the 50th percentile (median) and box bounds are the 25th and 75th percentiles. Outliers are >1.5× and <3× the IQR. c, Representative RNA images of mouse cortices showing Hspa1a puncta in Pecam1+ ECs in YX, OY, OO and OX mice. Scale bars, 20 µm. d, Violin and boxplot representation of RNA quantification (n = 4 biologically independent animals) by two-tailed Welch’s t-test with no multiple comparison adjustment for significance. P values for OY–YX: 3.535 × 10⁻¹⁶ (95% CI 2.727, 4.373); OY–OO 0.008 (95% CI −2.603, −0.385); OY–OX: 0.006 (95% CI −2.177, −0.372); OO–OX: 0.686 (95% CI −0.847, 1.286). NS P > 0.05, *P ≤ 0.05, **P ≤ 0.01, ***P ≤ 0.001, ****P ≤ 0.0001. Boxplot minimum is the smallest value within 1.5× the IQR below the 25th percentile and maximum is the largest value within 1.5× the IQR above the 75th percentile. Boxplot center is the 50th percentile (median) and box bounds are the 25th and 75th percentiles. Outliers are >1.5× and <3× the IQR.

