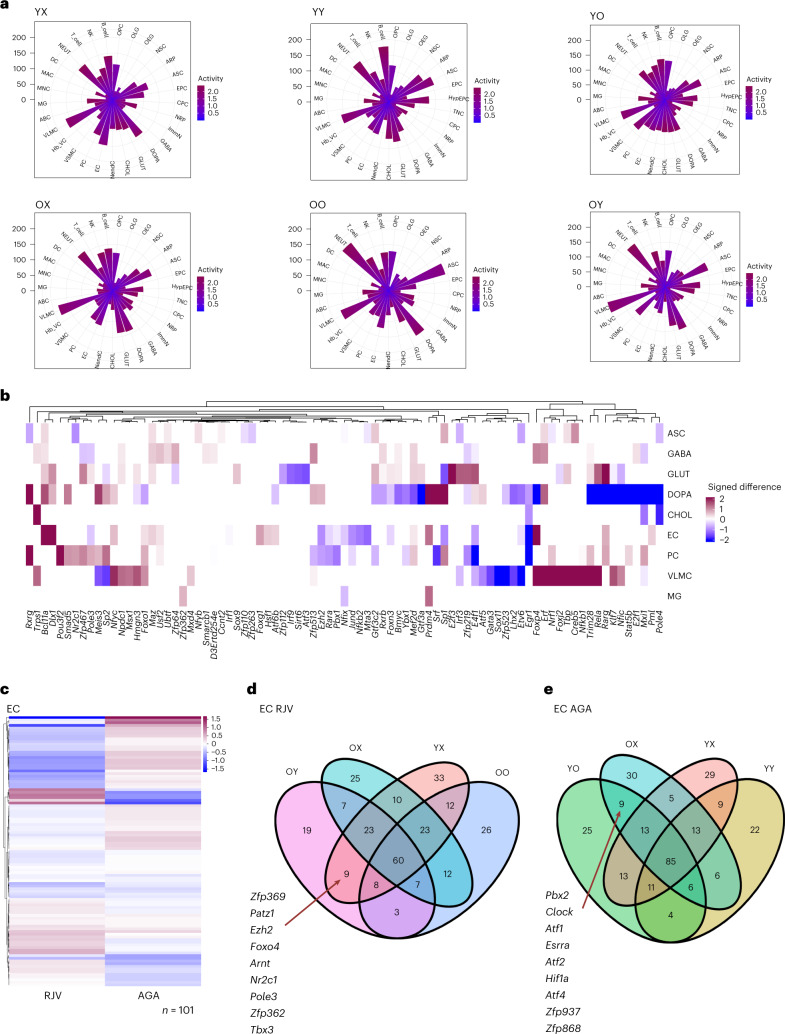
Fig. 6. Gene regulatory analysis reveals transcriptionally active cell types and GRN reversals between RJV and AGA.
a, Rose diagrams of GRN scores per cell type across YX, YY, YO, OX, OO and OY. The color scale from blue to magenta reflects the degree of GRN activity (Methods). b, Difference heatmap of active GRN TFs corresponding to RJV/AGA log(FC) change sign. Magnitude is the absolute magnitude of the difference, and direction is positive for upregulation in RJV (magenta) and negative for upregulation in AGA (blue). c, Heatmap of EC-active GRN TFs plotted by RJV and AGA log(FC), with upregulation magenta, downregulation blue, clustered with Euclidean distance, average linkage. d,e, Venn diagrams of EC RJV (d) and AGA (e) animal frameworks’ active GRN TFs. The arrows point to those TFs in common between OY and YX and YO and OX, respectively.

