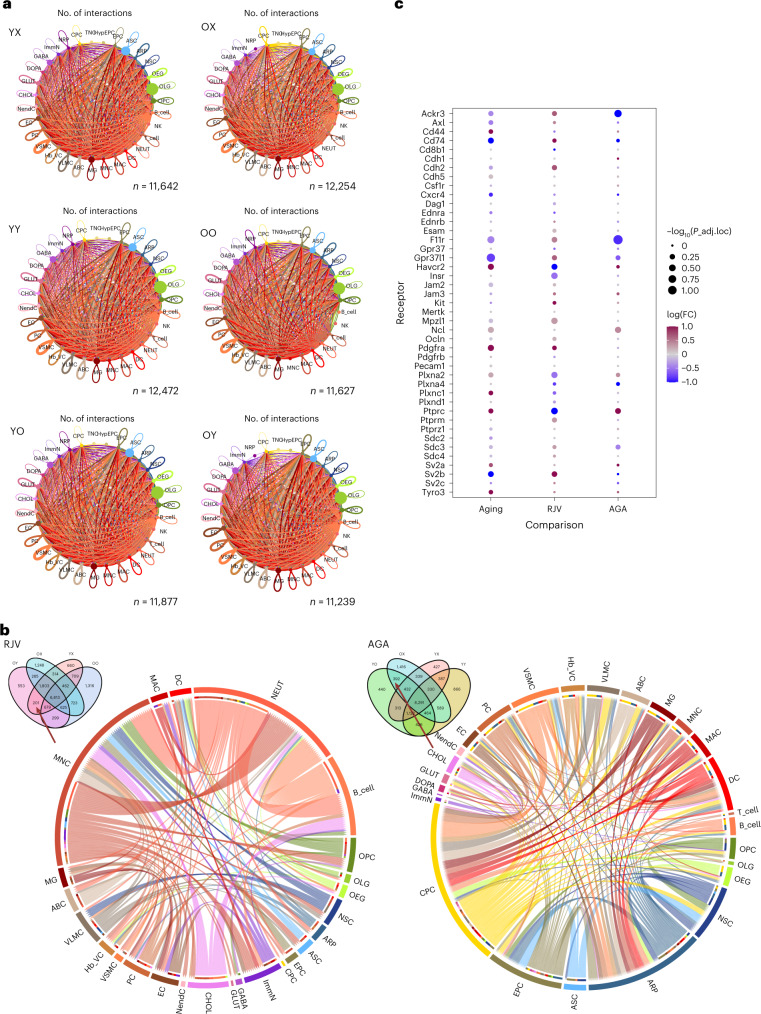
Fig. 7. Cell–cell communication is affected by aging and parabiosis.
a, Summarization network graphs of the number of ligand–receptor interactions between cell types in YX, YY, YO, OX, OO and OY mice. Node size is proportional to cell population size. Edge width and transparency of color are proportional to the number of all edges between a set of nodes. b, Chord diagrams representing the informatically predicted unique source:target:receptor:ligand pairings identified only in the rejuvenation model of OY and YX (Venn diagram inset, left panel) or the aging acceleration model of YO and OX (Venn diagram inset, right panel). c, For all identified EC receptors, edgeR DGE QLF test metrics are shown for the aging, RJV and AGA paradigms. Node size is inversely proportional to the Benjamini–Hochberg-adjusted P value for multiple comparisons and node color is scaled by intensity of log(FC) from blue (negative, downregulation) to magenta (positive, upregulation).

