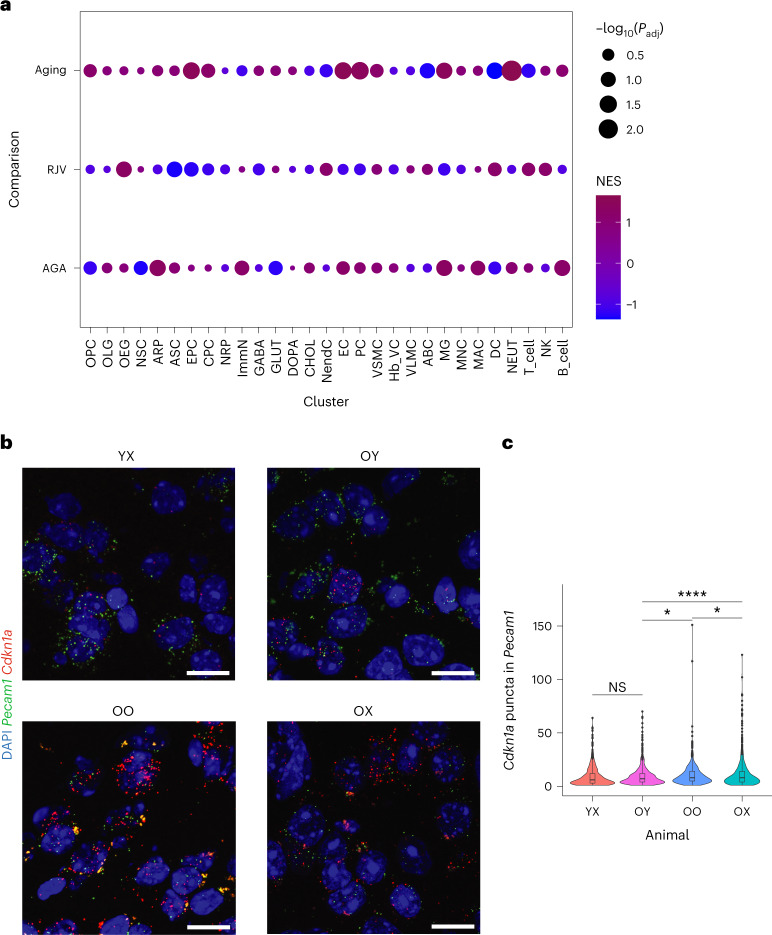
Fig. 8. Senescence status demonstrated shifts in aging and RJV.
a, Dot-plot representation of senescence-associated marker genes curated from the literature76,78, permuted against each cell type in aging, RJV and AGA with fast GSEA. The inverse log10(Padj) values for multiple comparisons (Benjamini–Hochberg) reflect the size of the dot and NESs reflect color from blue (negative enrichment) to magenta (positive enrichment). b, Representative RNA in situ images of mouse cortices showing Cdkn1a puncta in Pecam1+ ECs in YX, OY, OO and OX mice. Scale bars, 20 µm. c, Violin and boxplot representation of RNA quantification (n = 6 biologically independent animals) by two-tailed Welch’s t-test with no multiple comparison adjustment for significance. P values: OY–YX: 0.810 (95% CI −0.930, 1.190); OY–OO: 0.0484 (95% CI −1.670, −0.006); OY–OX: 0.0000874 (95% CI −3.063, −1.025); and OO–OX: 0.0251 (95% CI −2.260, −0.151). NS P > 0.05, *P ≤ 0.05, **P ≤ 0.01, ***P ≤ 0.001 and ****P < 0.0001. Boxplot minimum is the smallest value within 1.5× the IQR below the 25th percentile and maximum is the largest value within 1.5× the IQR above the 75th percentile. Boxplot center is the 50th percentile (median) and box bounds are the 25th and 75th percentiles. Outliers are >1.5× and <3× the IQR.

