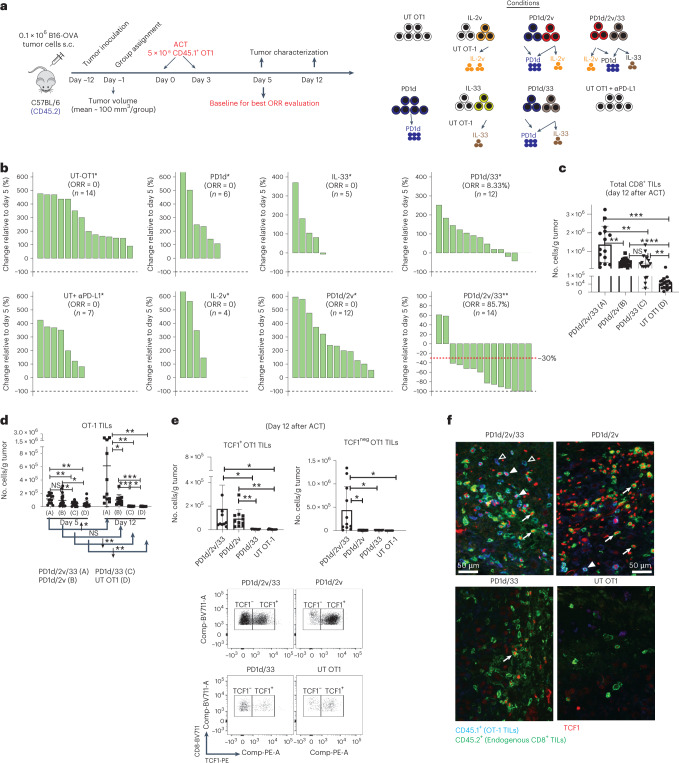
Fig. 1. Orthogonal T-cell engineering enables ACT efficacy without lymphodepletion through in situ expansion of TCF1+ precursor and TCF1neg effector CD8+ T cells.
a, Experimental design. s.c., subcutaneous. b, Waterfall plots showing changes in tumor volumes relative to day 5 after ACT. The best response (smallest tumor volume) observed for each animal after at least 12 d after the first infusion was taken for the calculation (*day 12 post infusion, **day 19 post infusion). ORR includes complete response (CR; 100% reduction in tumor volume) and partial response (PR ≤ −30% tumor change; n = 4–14 animals per group). c,d, Mice with B16-OVA tumors were treated with either engineered or untransduced OT1 cells as indicated. Tumors were collected on days 5 and 12 after ACT, and cell quantification was performed by flow cytometry. c, Total numbers of CD8+ TILs at day 12. Data are from four independent experiments (n = 4–5 animals per group per experiment). d, Total number of CD45.1+ OT1 cells on days 5 and 12; day 5: data are from four independent experiments, n = 4–5 animals per group per experiment; day 12: data are from two independent experiments, n = 5–6 animals per group per experiment. e, Total numbers of TCF1+ and TCF1neg OT1 TILs on day 12. Data are from two independent experiments (n = 6 animals per group). Data are presented as mean values ± s.d. A Brown–Forsythe and Welch analysis of variance (ANOVA) test combined with Tukey’s test to correct for multiple comparisons was used for comparing different groups in c and e. A two-tailed Student’s t-test with Welch’s correction was used for comparing day 5 and day 12 in d. *P < 0.05, **P < 0.01, ***P < 0.001, ****P < 0.0001. Representative dot plots show the distribution of CD8+ TILs of each indicated treatment based on the expression of TCF1. f, Representative immunofluorescence micrographs of tumor sections from each experimental group on day 12. Filled triangle, TCF1+OT1; open triangle, TCF1negOT1; white arrows, TCF1+ endogenous CD8+ TILs. NS, not significant.

