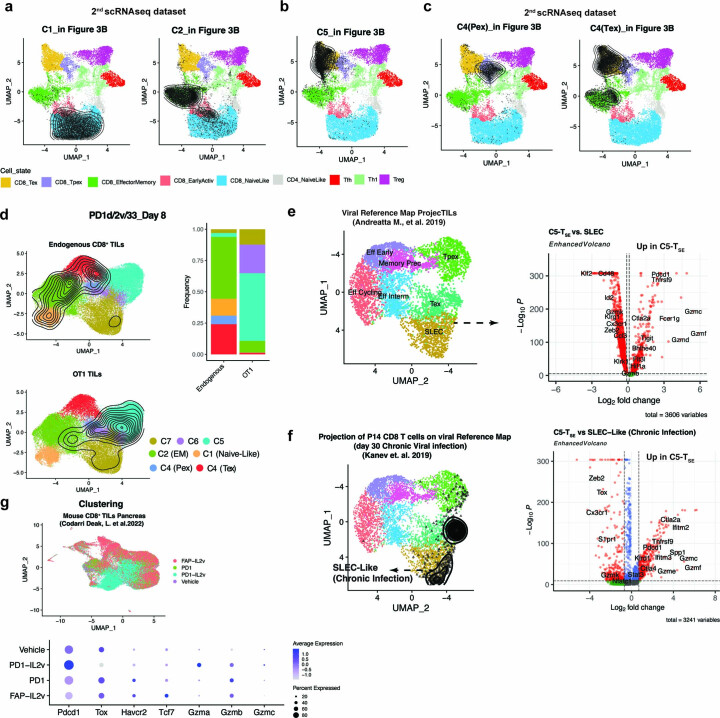
Extended Data Fig. 4. C5 is a novel T-synthetic cell effector state (TSE).
a-c Annotation of clusters C1-Naïve, C2-EffectorMemory, C5-TSE and C4 from the 2nd scRNAseq dataset based on their projection onto the reference mouse TIL map using ProjecTILs, where contour plots depict high cell density areas for each treatment. d UMAP plot showing the cluster distribution of either OT1 or endogenous CD8 TILs recovered at day 8 post orthogonal ACT. Contour plots depict the clusters covered by each cell compartment. Bar plots are showing the cluster composition of each compartment. e Comparison of C5-TSE TILs and SLEC effector cells induced upon acute viral infection. Volcano plot showing the DEGs between C5-TSE cells and SLEC like cells from the reference viral map21. Briefly, C5-TILs were projected onto the viral map using ProjecTILs. Next, the C5-TILs projected on the SLEC space were directly compared with SLEC-cells from the reference map for DEGs. Calculation performed with the function find.discriminant.genes (ProjecTILs) which performs differential expression based on the non-parameteric Wilcoxon rank sum test. f Comparison of C5-TSE TILs and Cx3cr1+ exhausted intermediate effector cells induced upon chronic viral infection. Volcano plot showing DEGs between C5-TSE cells and Cx3Cr1 + -SLEC like cells obtained from Kanev. et al64. Briefly, scRNAseq profile of P14 CD8 T cells harvested at day 30 post LCMV were projected in the viral reference map using ProjecTILs. Next, the cells classified as SLEC-like were directly compared to C5-TILs for DEGs. Calculation was performed with the function find.discriminant.genes (ProjecTILs) which performs differential expression analysis based on the non-parameteric Wilcoxon rank sum test. g Top part: UMAP plot showing the distribution of mouse TILs harvested from mice treated with either antiPD-1, FAP-IL2v, PD1_IL2v bispecific immunocytokine or vehicle, generated from (E-MTAB-11773), Codarri Deak L. el at. 202235. Bottom part: dot plot showing important T-cell gene markers.

