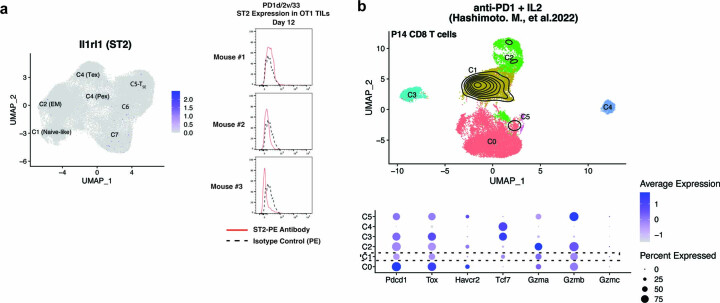
Extended Data Fig. 6. Synthetic CD8 T cells do not express ST2 and are distinct of those expanded by anti-PD-1 in combination with IL-2.
a Analysis of the Expression of ST2 at both RNA and protein levels. b Top part: UMAP plot showing the distribution of P14 CD8 T cells harvested from LCMV chronically infected mice treated with either antiPD-1, IL2 or their combination generated from (GSE206739), Hashimoto. M., et al.40. Contour plots depict the clusters covered by the combination. Bottom part: dot plot showing important T-cell gene markers.

