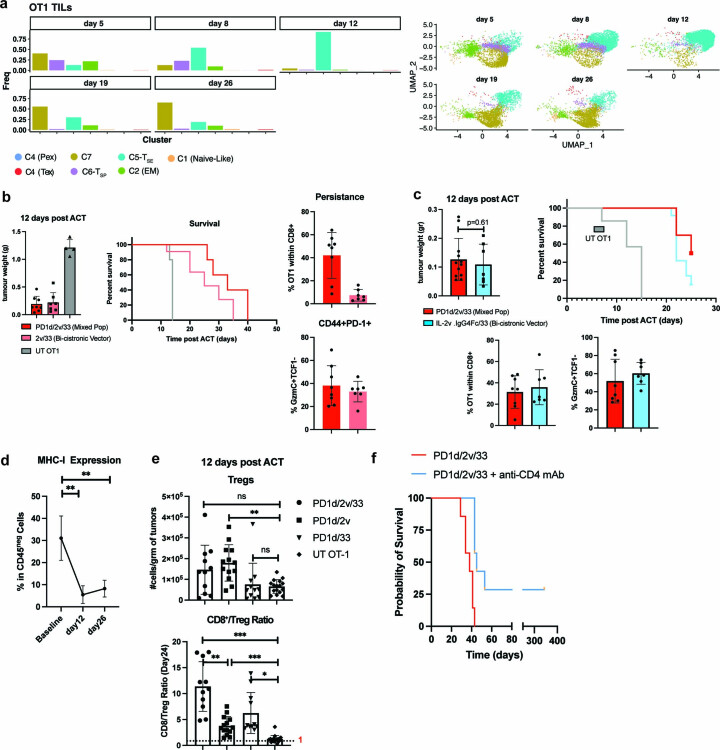
Extended Data Fig. 8. Tumor progression is not associated with canonical T-cell exhaustion.
a Dynamics of OT1 T-cell states over time. Left: bar plots showing cluster composition (Frequency) in each time point. Right OT1 single cells in each time point. b Left: tumor weight comparison and survival curves of B16.OVA-bearing mice treated with either UT OT1 or PD1d/2V/33 + OT1 cells (1:1 mixed PD1d/2v and PD1d/33 cells) or OT1 T cells transduced with a bicistronic vector comprising IL-2v and IL-33. Right part, top: Analysis of OT1 intratumoral persistence at day 12 post ACT and acquisition of the Gzmc+ TCF1neg C5-like cell state (bottom). Data are presented as mean values ± s.d. and are from 2 independent experiments except for UT OT1 (n = 4 mice). PD1d/2v/33 and 2v/33 (n = 4 mice/group/experiment). Data are presented as mean values ± s.d. c Similar to b, but this time OT1 T cells were transduced to express and secrete a dimeric IL-2v (IL-2v/IgG4) and IL-33. Data are presented as mean values ± s.d. and are from 2 independent experiments n = 6 mice/experiment for PD1d/2v/33 and n = 3–4 mice/experiment for IL2v.IgG4_IL33. Data are presented as mean values ± s.d. A two-tailed Student’s t-test with Welch’s correction was used for comparing both conditions. d Analysis of MHC-I expression overtime on CD45neg cells. Data are presented as mean values ± s.d. and are from two independent experiments for samples collected at baseline and day 12 (n = 4–5 mice/time point) and for one independent experiment for samples collected at day 26 (n = 4 mice). A two-tailed Student’s t-test with Welch’s correction was used for pairwise comparisons, **P < 0.01. e Top: tumor weight normalized numbers of Treg CD4+ T cells on day 12 post ACT. Bottom: CD8+/Treg ratio at day 12 post ACT. Mice with B16.OVA tumors were treated as indicated then tumors were harvested on day 12 post ACT, and Treg quantification was performed by flow cytometry. Data are presented as mean values ± s.d. and are from two independent experiments (n = 5–7 animals/group). An ordinary one-way ANOVA with a Tukey’s test for multiple comparison was performed for comparing conditions. NS, P > 0.05, *P < 0.05, **P < 0.01, ***P < 0.001, ****P < 0.0001. g A representative survival curve of PD1d/2V/33 + OT1-treated mice in the absence or presence of a depleting antibody specific for CD4 (n = 7 mice/condition) administered i.p. 250 μg/mouse beginning 1 d before initiation of PD1d/2V/33-ACT and maintained until day 43 post tumor inoculation. Survival curves were compared using a log-rank Mantel−Cox test.

