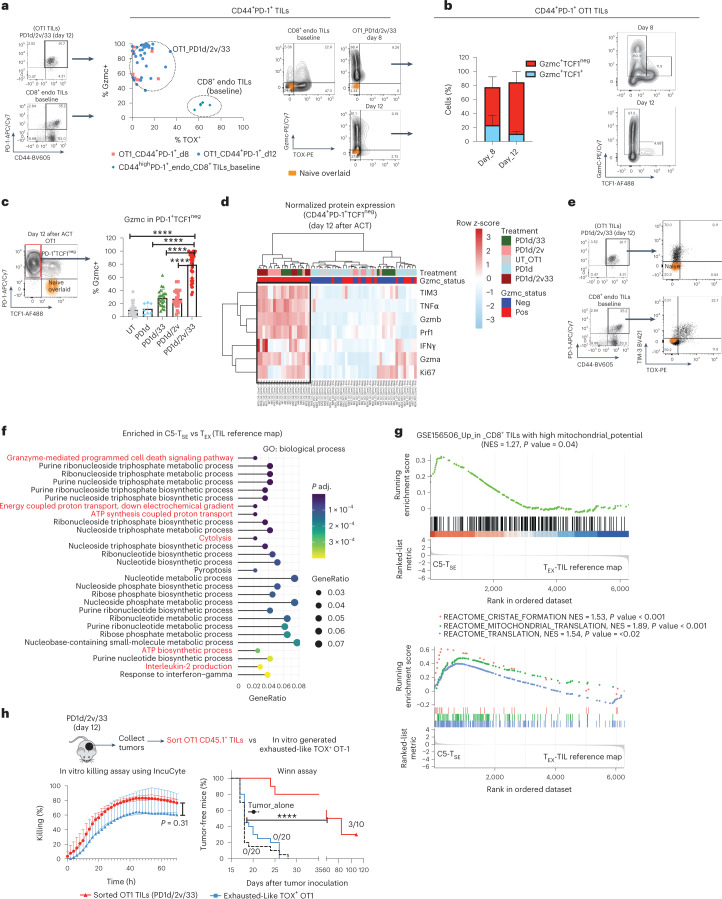
Fig. 4. C5 TSE OT1 TILs are polyfunctional effector cells with direct antitumor properties.
a, CD44, PD-1, TOX and Gzmc expression in OT1 TILs from animals treated with PD1d/IL-2v/IL-33 OT1 at day 8 (two independent experiments, n = 4 mice per group) and day 12 (five independent experiments, n = 5–6 mice per group) after transfer. CD8+ TILs isolated from tumor-bearing mice at baseline were used as the control (n = 6 mice per group). Representative dot plots depicting naïve CD8+ T cells from spleen of non-tumor-bearing mice used as negative control. b, Gzmc and TCF1 expression in PD-1+ TOXlo–neg OT1 TILs recovered at day 8 (two independent experiments, n = 4 mice per experiment) and day 12 (two independent experiments, n = 6 mice per experiment) after transfer. Representative contour plot. c, Analysis of Gzmc expression in PD-1+TCF1neg OT1 TILs recovered at day 12 after transfer. Data from five independent experiments except for PD1d (two independent experiments, n = 4 mice per experiment). UT, PD1d/IL-2v and PD1d/IL-33, n = 4–5 mice per group per experiment, PD1d/IL-2v/IL-33, n = 8 mice per experiment. Data are presented as mean values ± s.d. A Brown–Forsythe and Welch ANOVA test combined with Tukey’s test to correct for multiple comparisons was used for comparing different groups; *P < 0.05, **P < 0.01, ***P < 0.001, ****P < 0.0001. d, Heat map showing normalized protein expression estimated by FACS in PD-1+ TCF1neg OT1 TILs recovered at day 12. Each column represents an individual mouse (n = 35 mice in total). e, Representative dot plots showing the expression of TIM-3 and TOX. f, Gene Ontology (GO) biological process overrepresentation test of genes upregulated in TSE TILs relative to canonical TEX. g, GSEA gene set: CD8+ TILs with high mitochondrial potential36; ranked list: DEGs between C5 TSE and canonical TEX. Reactome pathway GSEA. Ranked list: DEGs between C5 TSE and canonical TEX. GSEA was performed with the GSEA function (clusterProfiler package) which uses the Benjamin–Hochberg method for multiple correction. Reactome pathway and GO enrichment were performed with the functions enrichReactome and enrichGO, respectively, from the same package, which uses a one-sided version of the Fisher’s exact overrepresentation test to find enriched categories. h, In vitro killing assay of sorted OT1 TILs 12 d after orthogonal ACT or in vitro-generated exhausted OT1 cells against labeled B16-OVA tumors using IncuCyte. A two-tailed Student’s t-test was used for comparing both conditions at 72 h. Antitumor potential of CD44+PD-1+TOXlo–negGzmC+ OT1 TILs recovered 12 d after transfer in a Winn assay53 (data from two independent experiments, n = 5 mice per experiment for PD1d/IL-2v/IL-33 group and n = 10 mice per experiment for the other two groups, n = 10 mice per experiment). Data are presented as mean values ± s.d. A log-rank (Mantel–Cox) test was used for comparing the curves. ****P < 0.0001.

