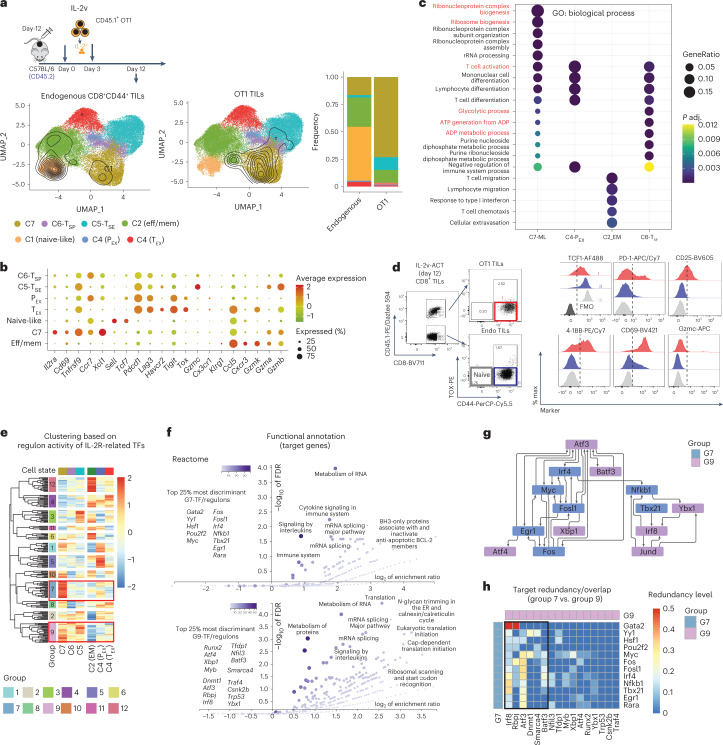
Fig. 8. IL-2v engineering contributes to key programs to the TSE state.
a, UMAP plot showing the cluster distribution of either OT1 TILs or endogenous CD8+ TILs recovered at day 12 after ACT from mice treated with IL-2v-secreting OT1 cells. Contour plots depict the clusters covered by each cell compartment. Bar plots show the cluster composition of each compartment. b, Dot plot showing C7-specific markers. c, GO biological process overrepresentation test of genes specifically upregulated in each memory-like subset. The calculation was performed with the function enrichGO (ClusterProfiler), which uses a one-sided version of the Fisher’s exact overrepresentation test to find enriched categories. d, Phenotypic validation at the protein level of some C7-specific markers in OT1 TILs recovered at day 12 after ACT from mice treated with IL-2v OT1 cells. e, Unsupervised clustering analysis based on the regulon activity across canonical and synthetic T-cell states of 181 TFs downstream of the IL-2R. f, Reactome pathway overrepresentation test using the targets genes of the top 25% most discriminant TFs of G7 and G9. The target list was analyzed for enrichment GO terms and Reactome pathways using the online tool WebGestalt (http://www.webgestalt.org/). g, Network connectivity analysis. To test whether the number of regulatory interactions between a given set of TFs was significantly higher than expected by chance from a random selection of TFs, a connectivity analysis was performed using the SANTA algorithm55 on the gene regulatory network derived from the regulon analysis. h, Target redundancy for two given TFs was calculated as the ratio between the number of common target elements in each regulon and the size of the smallest regulon (Methods).

