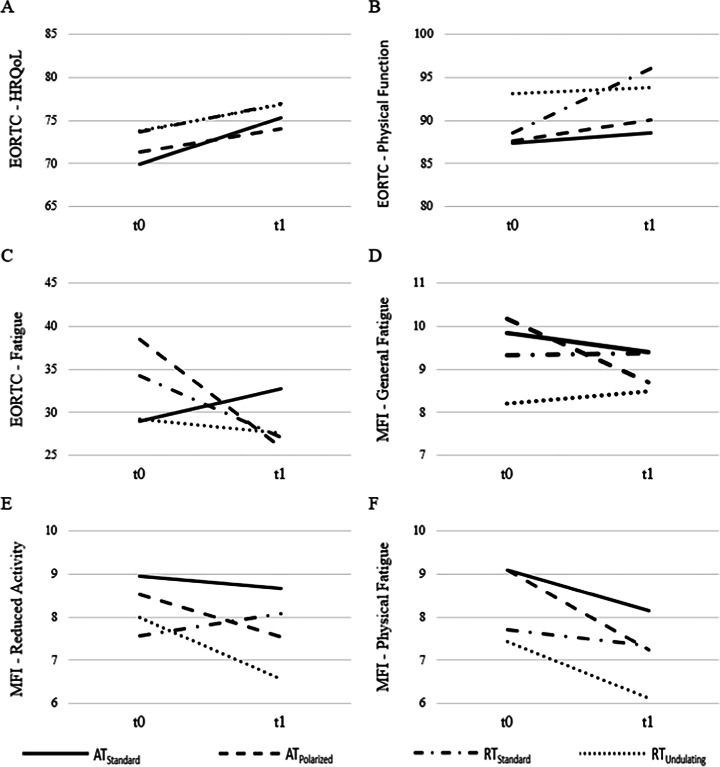
Fig. 2.
Changes in PRO’s during the intervention period. Mean changes over the intervention period for selected subscales of the EORTC-QLQ-C-30 and the MFI-20. Shown are EORTC-QLQ-C30 global health status (A) EORTC-QLQ-C30 physical function (B) EORTC-QLQ-C30 fatigue (C) (aerobic training standard group (ATStandard): n = 28; ATPolarized: n = 26; RTStandard: n = 26; RTUndulating: n = 27), MFI-20 general fatigue (D), MFI-20 physical fatigue (E) and MFI-20 reduced activity (F) (ATStandard: n = 25; ATPolarized: n = 23; RTStandard: n = 25; RTUndulating: n = 23) for the four training groups

