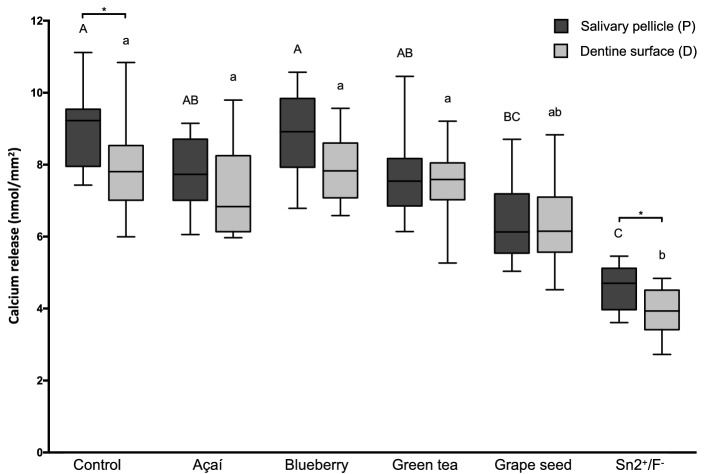
Figure 1.
Boxplots of the total amount of calcium released to the citric acid per mm2 of dentine. Different lower-case letters denote significant differences between the experimental groups for the action directly on the dentine surface (D). Different upper-case letters denote significant differences between the experimental groups for the action on the salivary pellicle (P). Bar with asterisk shows significant difference between D and P within the same group.

