
Figure 1.
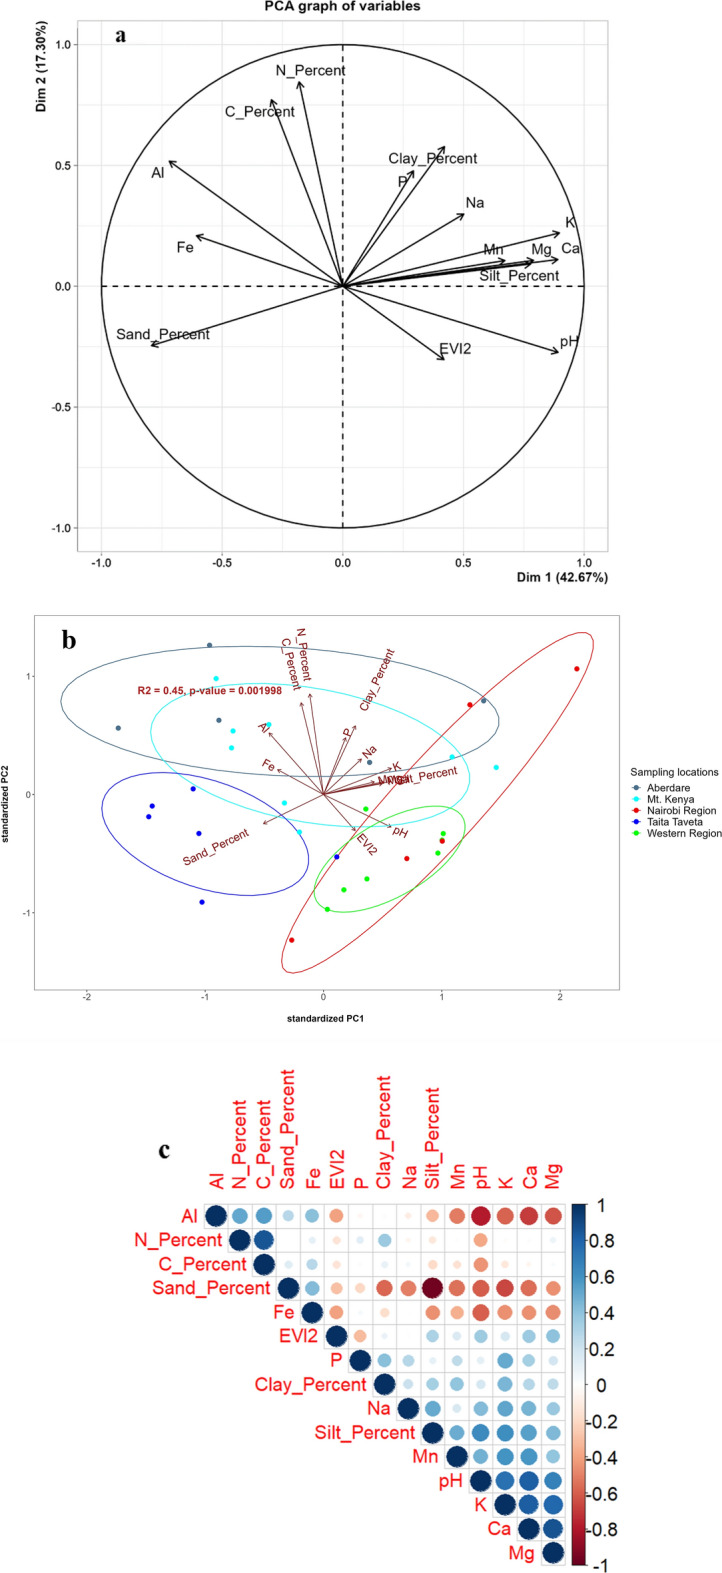
(a) Principal component analysis (PCA) biplot of forest soil samples according to their physicochemical properties. The influence of each variable on sample distribution is represented by the arrows radiating from the center of the PCA plot. (b) The sample clusters corresponding to different ecoregions are highlighted within ellipses of the same color. (c) Pearson correlation plot between measured soil physicochemical properties. Positive and negative correlations are displayed in blue and red shades, respectively, while the size and intensity of matrix circles is proportional to correlation coefficient between variables.